29
/
en
AIzaSyAYiBZKx7MnpbEhh9jyipgxe19OcubqV5w
April 1, 2024
130454
Ethiopia
ETH
true
2
1
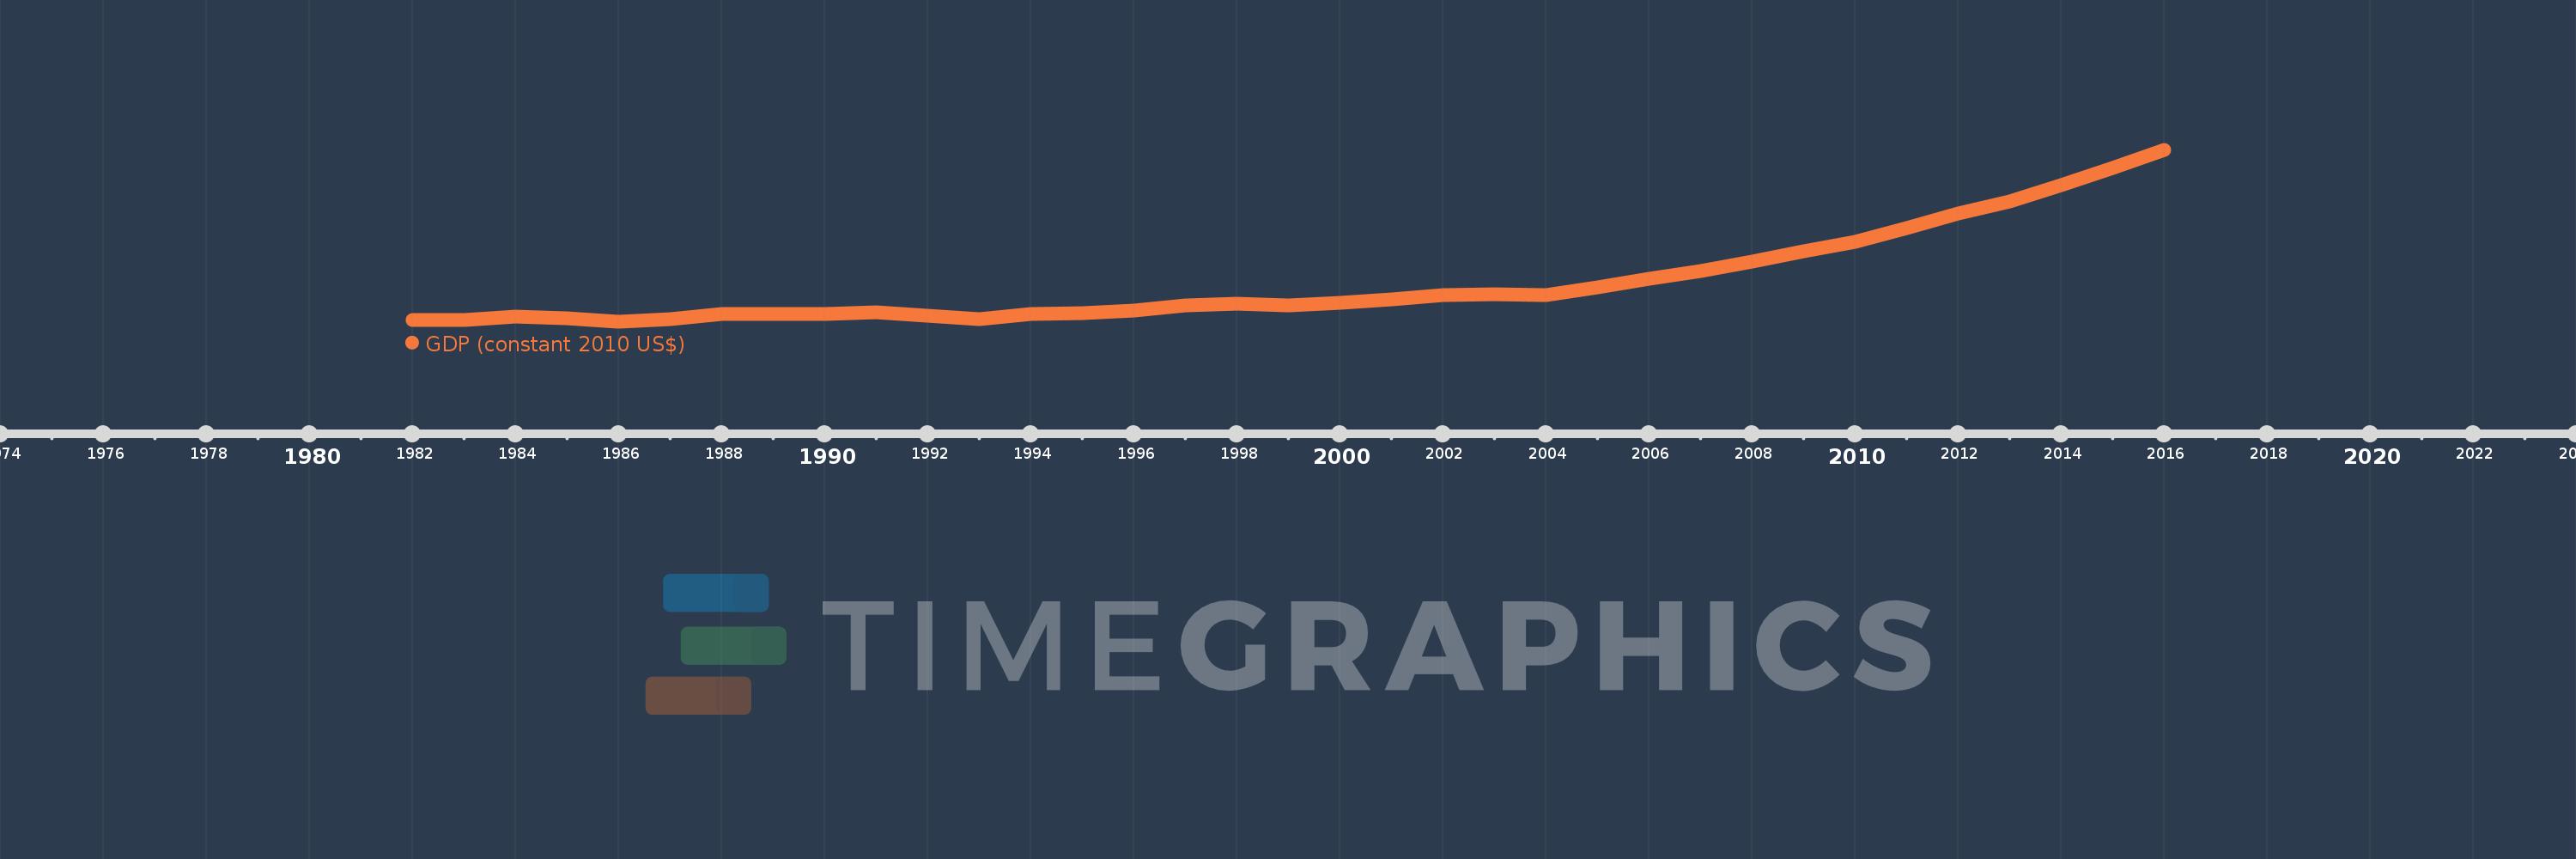
GDP (constant 2010 US$)
2016,2015,2014,2013,2012,2011,2010,2009,2008,2007,2006,2005,2004,2003,2002,2001,2000,1999,1998,1997,1996,1995,1994,1993,1992,1991,1990,1989,1988,1987,1986,1985,1984,1983,1982
This statistics in other country:
AfghanistanAlbaniaAlgeriaAndorraAngolaAntigua and BarbudaArab WorldArgentinaArmeniaArubaAustraliaAustriaAzerbaijanBahamas, TheBahrainBangladeshBarbadosBelarusBelgiumBelizeBeninBermudaBhutanBoliviaBosnia and HerzegovinaBotswanaBrazilBrunei DarussalamBulgariaBurkina FasoBurundiCabo VerdeCambodiaCameroonCanadaCaribbean small statesCentral African RepublicCentral Europe and the BalticsChadChileChinaColombiaComorosCongo, Dem. Rep.Congo, Rep.Costa RicaCote d'IvoireCroatiaCubaCyprusCzech RepublicDenmarkDjiboutiDominicaDominican RepublicEarly-demographic dividendEast Asia & PacificEast Asia & Pacific (excluding high income)East Asia & Pacific (IDA & IBRD countries)EcuadorEgypt, Arab Rep.El SalvadorEquatorial GuineaEritreaEstoniaEthiopiaEuro areaEurope & Central AsiaEurope & Central Asia (excluding high income)Europe & Central Asia (IDA & IBRD countries)European UnionFaroe IslandsFijiFinlandFragile and conflict affected situationsFranceGabonGambia, TheGeorgiaGermanyGhanaGreeceGreenlandGrenadaGuatemalaGuineaGuinea-BissauGuyanaHaitiHeavily indebted poor countries (HIPC)High incomeHondurasHong Kong SAR, ChinaHungaryIBRD onlyIcelandIDA & IBRD totalIDA blendIDA onlyIDA totalIndiaIndonesiaIran, Islamic Rep.IraqIrelandIsle of ManIsraelItalyJamaicaJapanJordanKazakhstanKenyaKiribatiKorea, Rep.KosovoKuwaitKyrgyz RepublicLao PDRLate-demographic dividendLatin America & Caribbean Latin America & Caribbean (excluding high income)Latin America & the Caribbean (IDA & IBRD countries)LatviaLeast developed countries: UN classificationLebanonLesothoLiberiaLibyaLiechtensteinLithuaniaLow & middle incomeLow incomeLower middle incomeLuxembourgMacao SAR, ChinaMacedonia, FYRMadagascarMalawiMalaysiaMaldivesMaliMaltaMarshall IslandsMauritaniaMauritiusMexicoMicronesia, Fed. Sts.Middle East & North AfricaMiddle East & North Africa (excluding high income)Middle East & North Africa (IDA & IBRD countries)Middle incomeMoldovaMonacoMongoliaMontenegroMoroccoMozambiqueMyanmarNamibiaNauruNepalNetherlandsNew ZealandNicaraguaNigerNigeriaNorth AmericaNorwayOECD membersOmanOther small statesPacific island small statesPakistanPalauPanamaPapua New GuineaParaguayPeruPhilippinesPolandPortugalPost-demographic dividendPre-demographic dividendPuerto RicoQatarRomaniaRussian FederationRwandaSamoaSao Tome and PrincipeSaudi ArabiaSenegalSerbiaSeychellesSierra LeoneSingaporeSlovak RepublicSloveniaSmall statesSolomon IslandsSouth AfricaSouth AsiaSouth Asia (IDA & IBRD)South SudanSpainSri LankaSt. Kitts and NevisSt. LuciaSt. Vincent and the GrenadinesSub-Saharan Africa Sub-Saharan Africa (excluding high income)Sub-Saharan Africa (IDA & IBRD countries)SudanSurinameSwazilandSwedenSwitzerlandTajikistanTanzaniaThailandTimor-LesteTogoTongaTrinidad and TobagoTunisiaTurkeyTurkmenistanTuvaluUgandaUkraineUnited Arab EmiratesUnited KingdomUnited StatesUpper middle incomeUruguayUzbekistanVanuatuVenezuela, RBVietnamWest Bank and GazaWorldYemen, Rep.ZambiaZimbabwe Timeline:
This timeline shows a graph from 1982 to 2016 of Ethiopia. No data until 1981. Number of actual observations by date: 35.
Source name:
World Development Indicators
Source organization:
World Bank national accounts data, and OECD National Accounts data files.
Categories, topics:
Economy & Growth
Last updated:
apr 23, 2017
Indicators value changes by year
Minimum:
7.758 bln
jan 1, 1986
Maximum:
48.331 bln
jan 1, 2016
At the date of observation
Value
Absolute change
Change from previous value
jan 1, 1982
8.228 bln
+8.228 bln
0.0%
jan 1, 1983
8.303 bln
+75.366 mln
0.92%
jan 1, 1984
8.987 bln
+683.75 mln
8.24%
jan 1, 1985
8.731 bln
-255.944 mln
-2.85%
jan 1, 1986
7.758 bln
-972.988 mln
-11.14%
jan 1, 1987
8.507 bln
+749.527 mln
9.66%
jan 1, 1988
9.686 bln
+1.179 bln
13.86%
jan 1, 1989
9.735 bln
+48.788 mln
0.5%
jan 1, 1990
9.7 bln
-35.148 mln
-0.36%
jan 1, 1991
9.964 bln
+264.466 mln
2.73%
jan 1, 1992
9.253 bln
-711.213 mln
-7.14%
jan 1, 1993
8.451 bln
-802.488 mln
-8.67%
jan 1, 1994
9.561 bln
+1.111 bln
13.14%
jan 1, 1995
9.866 bln
+305.007 mln
3.19%
jan 1, 1996
10.471 bln
+604.568 mln
6.13%
jan 1, 1997
11.772 bln
+1.301 bln
12.43%
jan 1, 1998
12.141 bln
+368.929 mln
3.13%
jan 1, 1999
11.721 bln
-419.856 mln
-3.46%
jan 1, 2000
12.326 bln
+605.068 mln
5.16%
jan 1, 2001
13.075 bln
+748.604 mln
6.07%
jan 1, 2002
14.16 bln
+1.085 bln
8.3%
jan 1, 2003
14.375 bln
+214.49 mln
1.51%
jan 1, 2004
14.064 bln
-310.691 mln
-2.16%
jan 1, 2005
15.973 bln
+1.909 bln
13.57%
jan 1, 2006
17.861 bln
+1.888 bln
11.82%
jan 1, 2007
19.796 bln
+1.935 bln
10.83%
jan 1, 2008
22.064 bln
+2.268 bln
11.46%
jan 1, 2009
24.444 bln
+2.38 bln
10.79%
jan 1, 2010
26.596 bln
+2.152 bln
8.8%
jan 1, 2011
29.934 bln
+3.338 bln
12.55%
jan 1, 2012
33.28 bln
+3.346 bln
11.18%
jan 1, 2013
36.158 bln
+2.878 bln
8.65%
jan 1, 2014
39.984 bln
+3.826 bln
10.58%
jan 1, 2015
44.094 bln
+4.11 bln
10.28%
jan 1, 2016
48.331 bln
+4.236 bln
9.61%
Ranking of countries by current statistics by years


Comments: