29
/
en
AIzaSyAYiBZKx7MnpbEhh9jyipgxe19OcubqV5w
April 1, 2024
122121
Dominican Republic
DOM
true
2
1
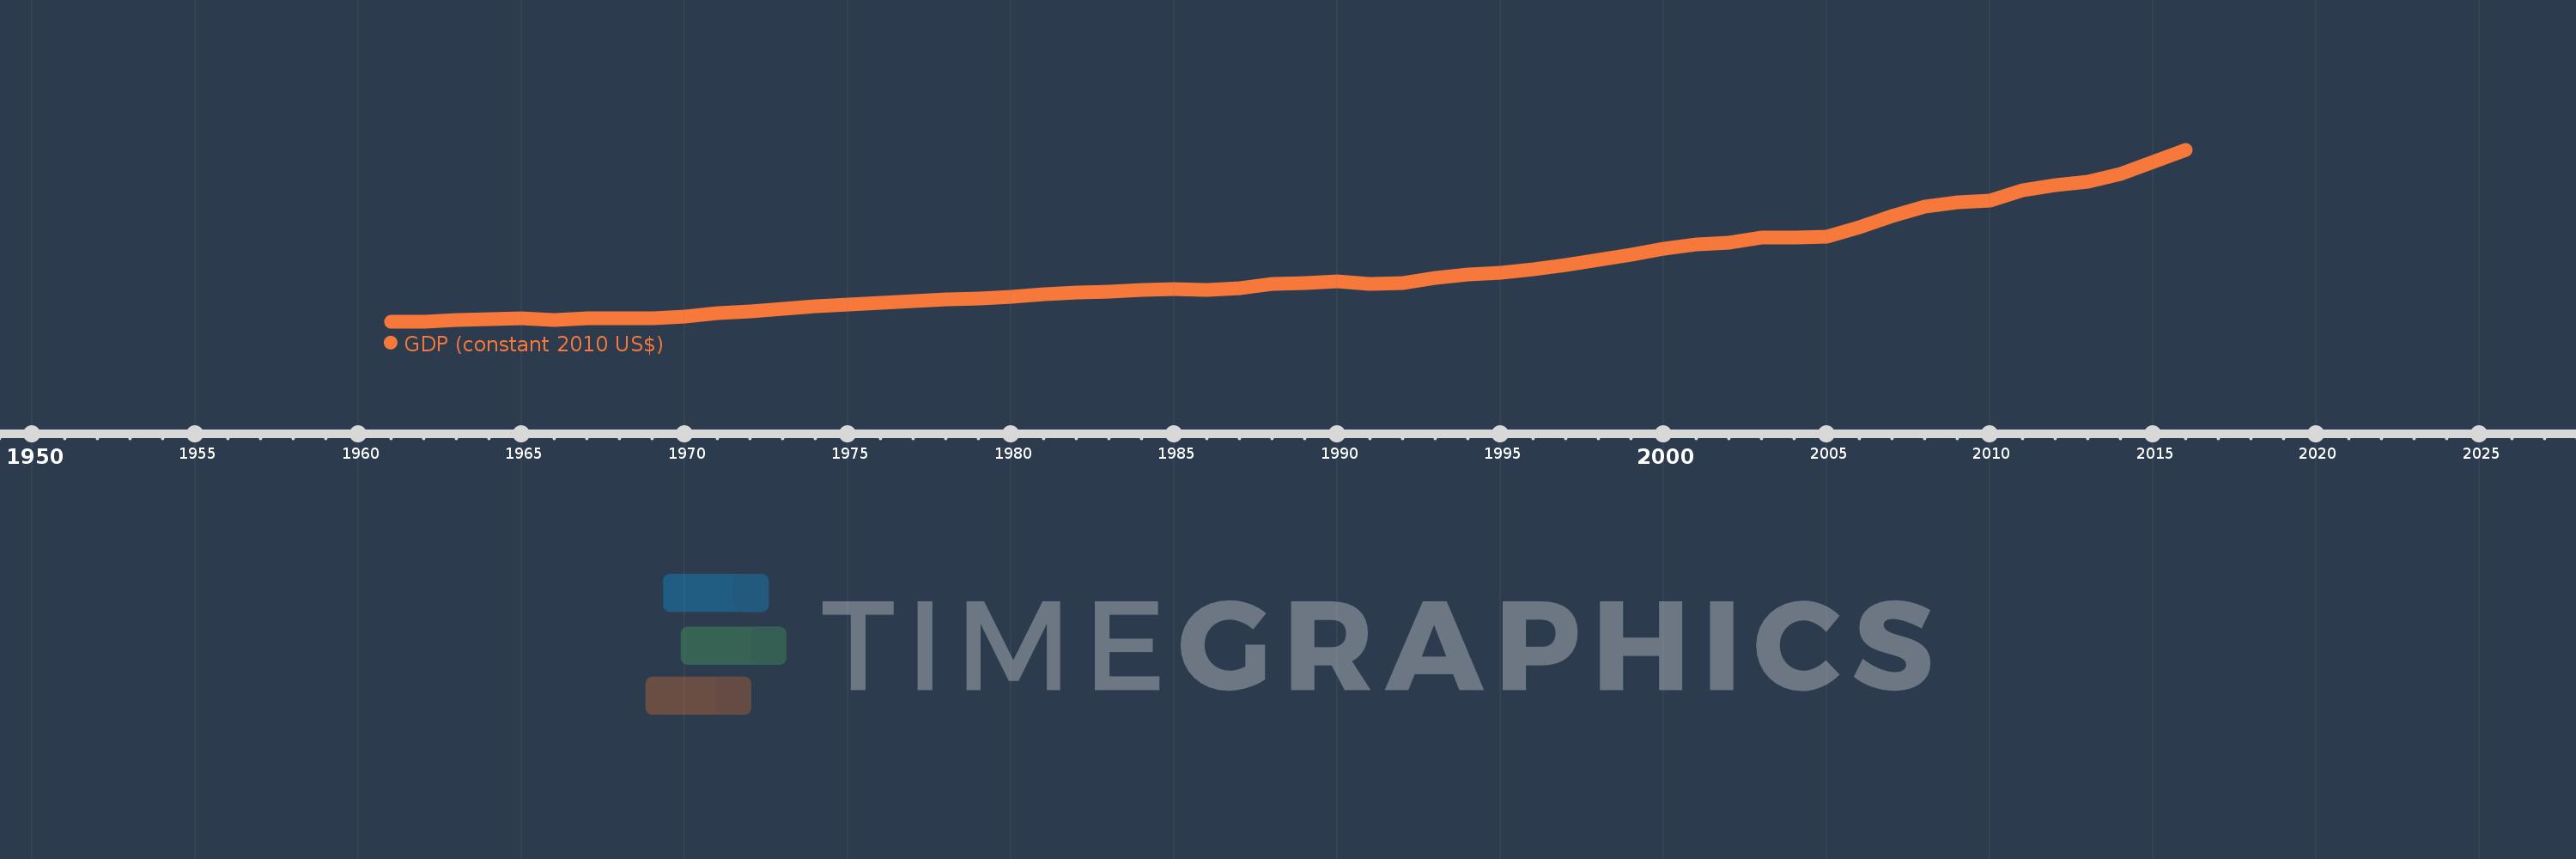
GDP (constant 2010 US$)
2016,2015,2014,2013,2012,2011,2010,2009,2008,2007,2006,2005,2004,2003,2002,2001,2000,1999,1998,1997,1996,1995,1994,1993,1992,1991,1990,1989,1988,1987,1986,1985,1984,1983,1982,1981,1980,1979,1978,1977,1976,1975,1974,1973,1972,1971,1970,1969,1968,1967,1966,1965,1964,1963,1962,1961
This statistics in other country:
AfghanistanAlbaniaAlgeriaAndorraAngolaAntigua and BarbudaArab WorldArgentinaArmeniaArubaAustraliaAustriaAzerbaijanBahamas, TheBahrainBangladeshBarbadosBelarusBelgiumBelizeBeninBermudaBhutanBoliviaBosnia and HerzegovinaBotswanaBrazilBrunei DarussalamBulgariaBurkina FasoBurundiCabo VerdeCambodiaCameroonCanadaCaribbean small statesCentral African RepublicCentral Europe and the BalticsChadChileChinaColombiaComorosCongo, Dem. Rep.Congo, Rep.Costa RicaCote d'IvoireCroatiaCubaCyprusCzech RepublicDenmarkDjiboutiDominicaDominican RepublicEarly-demographic dividendEast Asia & PacificEast Asia & Pacific (excluding high income)East Asia & Pacific (IDA & IBRD countries)EcuadorEgypt, Arab Rep.El SalvadorEquatorial GuineaEritreaEstoniaEthiopiaEuro areaEurope & Central AsiaEurope & Central Asia (excluding high income)Europe & Central Asia (IDA & IBRD countries)European UnionFaroe IslandsFijiFinlandFragile and conflict affected situationsFranceGabonGambia, TheGeorgiaGermanyGhanaGreeceGreenlandGrenadaGuatemalaGuineaGuinea-BissauGuyanaHaitiHeavily indebted poor countries (HIPC)High incomeHondurasHong Kong SAR, ChinaHungaryIBRD onlyIcelandIDA & IBRD totalIDA blendIDA onlyIDA totalIndiaIndonesiaIran, Islamic Rep.IraqIrelandIsle of ManIsraelItalyJamaicaJapanJordanKazakhstanKenyaKiribatiKorea, Rep.KosovoKuwaitKyrgyz RepublicLao PDRLate-demographic dividendLatin America & Caribbean Latin America & Caribbean (excluding high income)Latin America & the Caribbean (IDA & IBRD countries)LatviaLeast developed countries: UN classificationLebanonLesothoLiberiaLibyaLiechtensteinLithuaniaLow & middle incomeLow incomeLower middle incomeLuxembourgMacao SAR, ChinaMacedonia, FYRMadagascarMalawiMalaysiaMaldivesMaliMaltaMarshall IslandsMauritaniaMauritiusMexicoMicronesia, Fed. Sts.Middle East & North AfricaMiddle East & North Africa (excluding high income)Middle East & North Africa (IDA & IBRD countries)Middle incomeMoldovaMonacoMongoliaMontenegroMoroccoMozambiqueMyanmarNamibiaNauruNepalNetherlandsNew ZealandNicaraguaNigerNigeriaNorth AmericaNorwayOECD membersOmanOther small statesPacific island small statesPakistanPalauPanamaPapua New GuineaParaguayPeruPhilippinesPolandPortugalPost-demographic dividendPre-demographic dividendPuerto RicoQatarRomaniaRussian FederationRwandaSamoaSao Tome and PrincipeSaudi ArabiaSenegalSerbiaSeychellesSierra LeoneSingaporeSlovak RepublicSloveniaSmall statesSolomon IslandsSouth AfricaSouth AsiaSouth Asia (IDA & IBRD)South SudanSpainSri LankaSt. Kitts and NevisSt. LuciaSt. Vincent and the GrenadinesSub-Saharan Africa Sub-Saharan Africa (excluding high income)Sub-Saharan Africa (IDA & IBRD countries)SudanSurinameSwazilandSwedenSwitzerlandTajikistanTanzaniaThailandTimor-LesteTogoTongaTrinidad and TobagoTunisiaTurkeyTurkmenistanTuvaluUgandaUkraineUnited Arab EmiratesUnited KingdomUnited StatesUpper middle incomeUruguayUzbekistanVanuatuVenezuela, RBVietnamWest Bank and GazaWorldYemen, Rep.ZambiaZimbabwe Timeline:
This timeline shows a graph from 1961 to 2016 of Dominican Republic. No data until 1960. Number of actual observations by date: 56.
Source name:
World Development Indicators
Source organization:
World Bank national accounts data, and OECD National Accounts data files.
Categories, topics:
Economy & Growth
Last updated:
apr 23, 2017
Indicators value changes by year
Minimum:
4.107 bln
jan 1, 1962
Maximum:
68.989 bln
jan 1, 2016
At the date of observation
Value
Absolute change
Change from previous value
jan 1, 1961
4.205 bln
+4.205 bln
0.0%
jan 1, 1962
4.107 bln
-97.261 mln
-2.31%
jan 1, 1963
4.807 bln
+700.176 mln
17.05%
jan 1, 1964
5.12 bln
+312.623 mln
6.5%
jan 1, 1965
5.466 bln
+346.366 mln
6.76%
jan 1, 1966
4.784 bln
-682.311 mln
-12.48%
jan 1, 1967
5.428 bln
+644.103 mln
13.46%
jan 1, 1968
5.609 bln
+180.627 mln
3.33%
jan 1, 1969
5.622 bln
+13.397 mln
0.24%
jan 1, 1970
6.235 bln
+612.344 mln
10.89%
jan 1, 1971
7.371 bln
+1.136 bln
18.23%
jan 1, 1972
8.172 bln
+801.331 mln
10.87%
jan 1, 1973
9.022 bln
+849.441 mln
10.39%
jan 1, 1974
10.185 bln
+1.163 bln
12.9%
jan 1, 1975
10.796 bln
+611.303 mln
6.0%
jan 1, 1976
11.357 bln
+560.687 mln
5.19%
jan 1, 1977
12.121 bln
+764.122 mln
6.73%
jan 1, 1978
12.725 bln
+603.855 mln
4.98%
jan 1, 1979
12.998 bln
+272.405 mln
2.14%
jan 1, 1980
13.586 bln
+588.969 mln
4.53%
jan 1, 1981
14.669 bln
+1.083 bln
7.97%
jan 1, 1982
15.297 bln
+627.82 mln
4.28%
jan 1, 1983
15.557 bln
+259.851 mln
1.7%
jan 1, 1984
16.277 bln
+719.962 mln
4.63%
jan 1, 1985
16.481 bln
+203.931 mln
1.25%
jan 1, 1986
16.131 bln
-349.809 mln
-2.12%
jan 1, 1987
16.699 bln
+568.13 mln
3.52%
jan 1, 1988
18.389 bln
+1.69 bln
10.12%
jan 1, 1989
18.785 bln
+396.45 mln
2.16%
jan 1, 1990
19.612 bln
+826.641 mln
4.4%
jan 1, 1991
18.542 bln
-1.07 bln
-5.45%
jan 1, 1992
18.717 bln
+175.062 mln
0.94%
jan 1, 1993
20.685 bln
+1.968 bln
10.51%
jan 1, 1994
22.179 bln
+1.494 bln
7.22%
jan 1, 1995
22.69 bln
+510.834 mln
2.3%
jan 1, 1996
23.936 bln
+1.246 bln
5.49%
jan 1, 1997
25.643 bln
+1.707 bln
7.13%
jan 1, 1998
27.696 bln
+2.053 bln
8.0%
jan 1, 1999
29.637 bln
+1.942 bln
7.01%
jan 1, 2000
31.627 bln
+1.99 bln
6.72%
jan 1, 2001
33.416 bln
+1.789 bln
5.66%
jan 1, 2002
34.021 bln
+604.581 mln
1.81%
jan 1, 2003
35.99 bln
+1.969 bln
5.79%
jan 1, 2004
35.899 bln
-91.185 mln
-0.25%
jan 1, 2005
36.37 bln
+470.981 mln
1.31%
jan 1, 2006
39.739 bln
+3.369 bln
9.26%
jan 1, 2007
43.98 bln
+4.241 bln
10.67%
jan 1, 2008
47.81 bln
+3.831 bln
8.71%
jan 1, 2009
49.345 bln
+1.534 bln
3.21%
jan 1, 2010
49.812 bln
+466.879 mln
0.95%
jan 1, 2011
53.955 bln
+4.143 bln
8.32%
jan 1, 2012
55.628 bln
+1.674 bln
3.1%
jan 1, 2013
57.182 bln
+1.554 bln
2.79%
jan 1, 2014
59.894 bln
+2.712 bln
4.74%
jan 1, 2015
64.451 bln
+4.557 bln
7.61%
jan 1, 2016
68.989 bln
+4.538 bln
7.04%
Ranking of countries by current statistics by years


Comments: