29
/
en
AIzaSyAYiBZKx7MnpbEhh9jyipgxe19OcubqV5w
April 1, 2024
172838
Kyrgyz Republic
KGZ
true
2
1
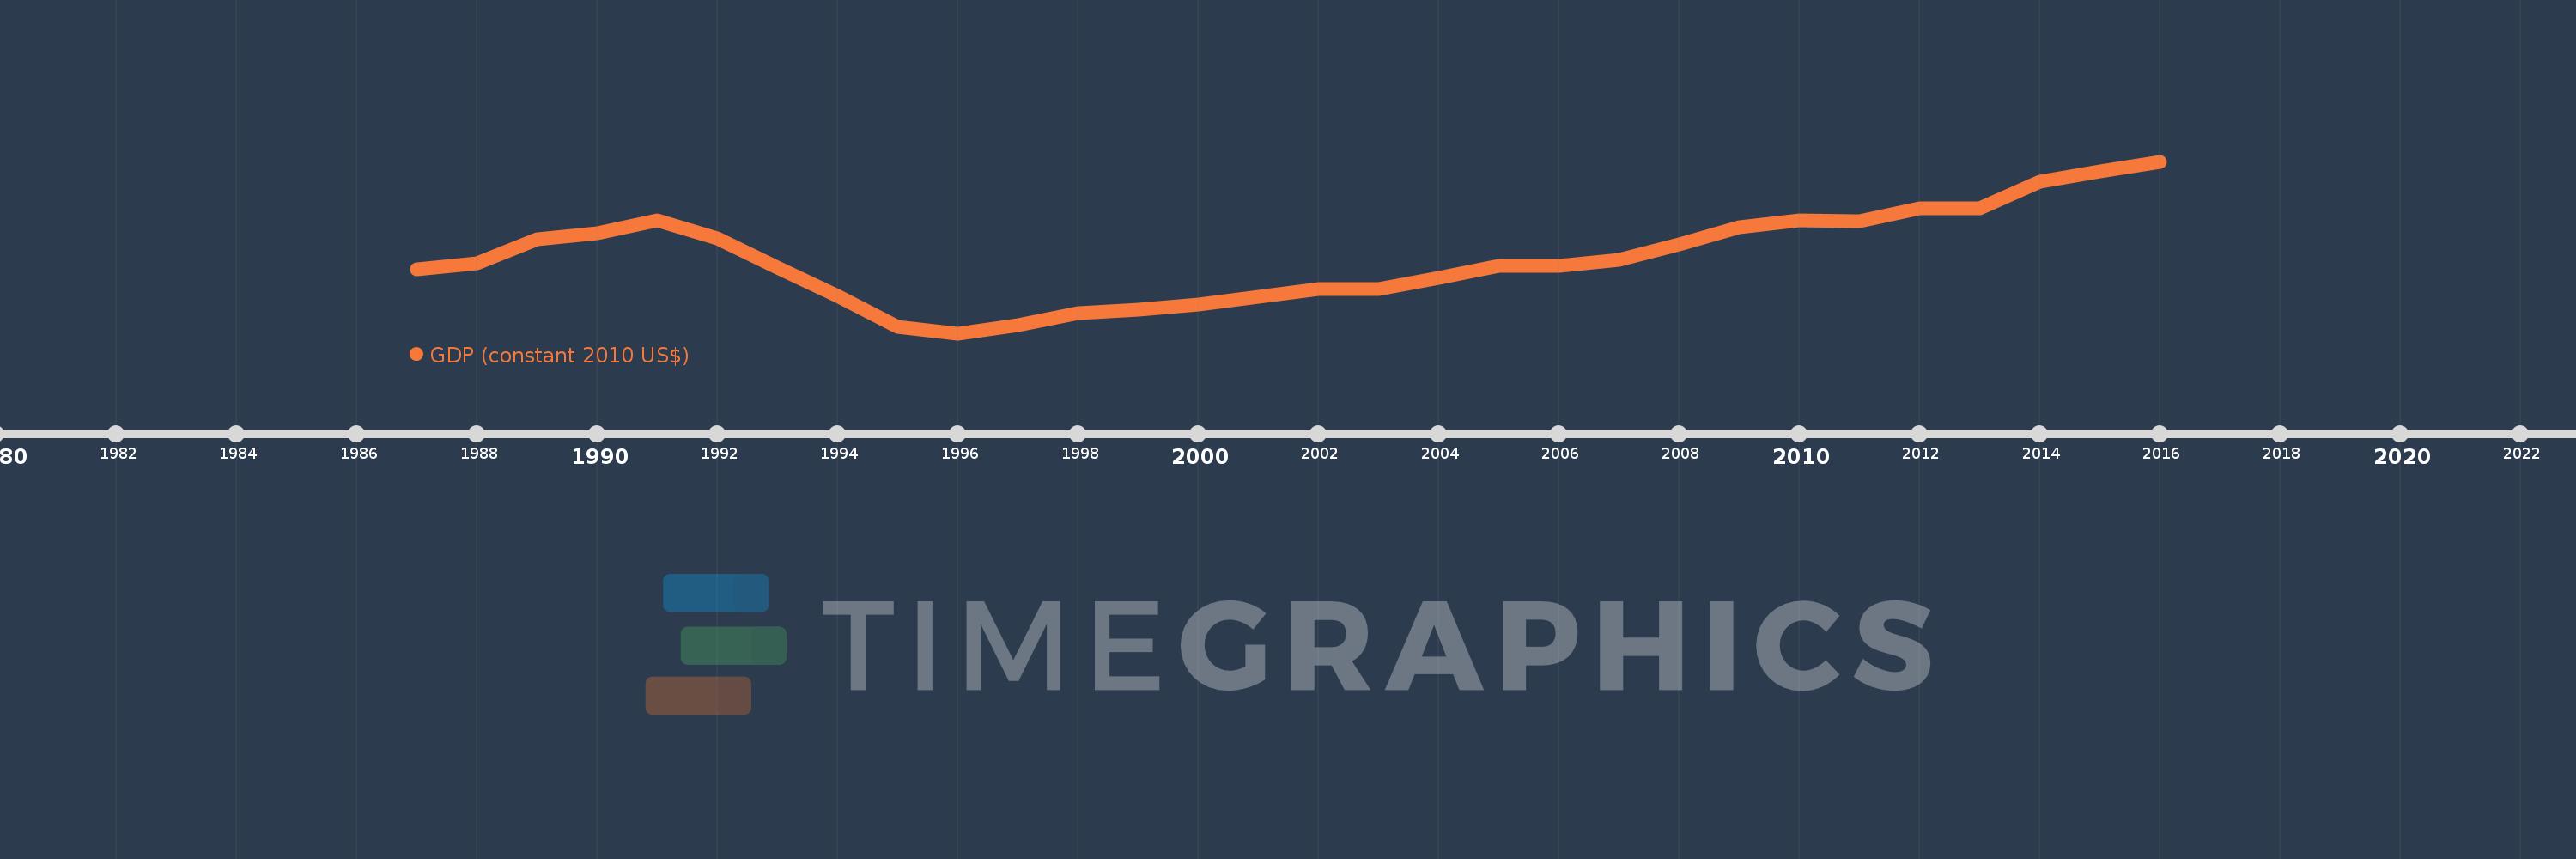
GDP (constant 2010 US$)
2016,2015,2014,2013,2012,2011,2010,2009,2008,2007,2006,2005,2004,2003,2002,2001,2000,1999,1998,1997,1996,1995,1994,1993,1992,1991,1990,1989,1988,1987
This statistics in other country:
AfghanistanAlbaniaAlgeriaAndorraAngolaAntigua and BarbudaArab WorldArgentinaArmeniaArubaAustraliaAustriaAzerbaijanBahamas, TheBahrainBangladeshBarbadosBelarusBelgiumBelizeBeninBermudaBhutanBoliviaBosnia and HerzegovinaBotswanaBrazilBrunei DarussalamBulgariaBurkina FasoBurundiCabo VerdeCambodiaCameroonCanadaCaribbean small statesCentral African RepublicCentral Europe and the BalticsChadChileChinaColombiaComorosCongo, Dem. Rep.Congo, Rep.Costa RicaCote d'IvoireCroatiaCubaCyprusCzech RepublicDenmarkDjiboutiDominicaDominican RepublicEarly-demographic dividendEast Asia & PacificEast Asia & Pacific (excluding high income)East Asia & Pacific (IDA & IBRD countries)EcuadorEgypt, Arab Rep.El SalvadorEquatorial GuineaEritreaEstoniaEthiopiaEuro areaEurope & Central AsiaEurope & Central Asia (excluding high income)Europe & Central Asia (IDA & IBRD countries)European UnionFaroe IslandsFijiFinlandFragile and conflict affected situationsFranceGabonGambia, TheGeorgiaGermanyGhanaGreeceGreenlandGrenadaGuatemalaGuineaGuinea-BissauGuyanaHaitiHeavily indebted poor countries (HIPC)High incomeHondurasHong Kong SAR, ChinaHungaryIBRD onlyIcelandIDA & IBRD totalIDA blendIDA onlyIDA totalIndiaIndonesiaIran, Islamic Rep.IraqIrelandIsle of ManIsraelItalyJamaicaJapanJordanKazakhstanKenyaKiribatiKorea, Rep.KosovoKuwaitKyrgyz RepublicLao PDRLate-demographic dividendLatin America & Caribbean Latin America & Caribbean (excluding high income)Latin America & the Caribbean (IDA & IBRD countries)LatviaLeast developed countries: UN classificationLebanonLesothoLiberiaLibyaLiechtensteinLithuaniaLow & middle incomeLow incomeLower middle incomeLuxembourgMacao SAR, ChinaMacedonia, FYRMadagascarMalawiMalaysiaMaldivesMaliMaltaMarshall IslandsMauritaniaMauritiusMexicoMicronesia, Fed. Sts.Middle East & North AfricaMiddle East & North Africa (excluding high income)Middle East & North Africa (IDA & IBRD countries)Middle incomeMoldovaMonacoMongoliaMontenegroMoroccoMozambiqueMyanmarNamibiaNauruNepalNetherlandsNew ZealandNicaraguaNigerNigeriaNorth AmericaNorwayOECD membersOmanOther small statesPacific island small statesPakistanPalauPanamaPapua New GuineaParaguayPeruPhilippinesPolandPortugalPost-demographic dividendPre-demographic dividendPuerto RicoQatarRomaniaRussian FederationRwandaSamoaSao Tome and PrincipeSaudi ArabiaSenegalSerbiaSeychellesSierra LeoneSingaporeSlovak RepublicSloveniaSmall statesSolomon IslandsSouth AfricaSouth AsiaSouth Asia (IDA & IBRD)South SudanSpainSri LankaSt. Kitts and NevisSt. LuciaSt. Vincent and the GrenadinesSub-Saharan Africa Sub-Saharan Africa (excluding high income)Sub-Saharan Africa (IDA & IBRD countries)SudanSurinameSwazilandSwedenSwitzerlandTajikistanTanzaniaThailandTimor-LesteTogoTongaTrinidad and TobagoTunisiaTurkeyTurkmenistanTuvaluUgandaUkraineUnited Arab EmiratesUnited KingdomUnited StatesUpper middle incomeUruguayUzbekistanVanuatuVenezuela, RBVietnamWest Bank and GazaWorldYemen, Rep.ZambiaZimbabwe Timeline:
This timeline shows a graph from 1987 to 2016 of Kyrgyz Republic. No data until 1986. Number of actual observations by date: 30.
Source name:
World Development Indicators
Source organization:
World Bank national accounts data, and OECD National Accounts data files.
Categories, topics:
Economy & Growth
Last updated:
apr 23, 2017
Indicators value changes by year
Minimum:
2.44 bln
jan 1, 1996
Maximum:
6.059 bln
jan 1, 2016
At the date of observation
Value
Absolute change
Change from previous value
jan 1, 1987
3.788 bln
+3.788 bln
0.0%
jan 1, 1988
3.913 bln
+124.995 mln
3.3%
jan 1, 1989
4.429 bln
+516.487 mln
13.2%
jan 1, 1990
4.553 bln
+123.565 mln
2.79%
jan 1, 1991
4.812 bln
+259.638 mln
5.7%
jan 1, 1992
4.435 bln
-377.829 mln
-7.85%
jan 1, 1993
3.819 bln
-615.913 mln
-13.89%
jan 1, 1994
3.228 bln
-590.348 mln
-15.46%
jan 1, 1995
2.58 bln
-648.423 mln
-20.09%
jan 1, 1996
2.44 bln
-139.932 mln
-5.42%
jan 1, 1997
2.613 bln
+172.863 mln
7.08%
jan 1, 1998
2.872 bln
+259.071 mln
9.92%
jan 1, 1999
2.933 bln
+60.938 mln
2.12%
jan 1, 2000
3.04 bln
+107.22 mln
3.66%
jan 1, 2001
3.205 bln
+164.977 mln
5.43%
jan 1, 2002
3.376 bln
+170.561 mln
5.32%
jan 1, 2003
3.375 bln
-585.781K
-0.02%
jan 1, 2004
3.612 bln
+237.277 mln
7.03%
jan 1, 2005
3.866 bln
+253.834 mln
7.03%
jan 1, 2006
3.859 bln
-6.787 mln
-0.18%
jan 1, 2007
3.979 bln
+119.753 mln
3.1%
jan 1, 2008
4.319 bln
+339.933 mln
8.54%
jan 1, 2009
4.682 bln
+362.871 mln
8.4%
jan 1, 2010
4.817 bln
+135.135 mln
2.89%
jan 1, 2011
4.794 bln
-22.716 mln
-0.47%
jan 1, 2012
5.08 bln
+285.565 mln
5.96%
jan 1, 2013
5.075 bln
-4.478 mln
-0.09%
jan 1, 2014
5.629 bln
+554.009 mln
10.92%
jan 1, 2015
5.856 bln
+226.531 mln
4.02%
jan 1, 2016
6.059 bln
+203.161 mln
3.47%
Ranking of countries by current statistics by years


Comments: