29
/
en
AIzaSyAYiBZKx7MnpbEhh9jyipgxe19OcubqV5w
April 1, 2024
60759
Sub-Saharan Africa (IDA & IBRD countries)
TSS
false
2
1
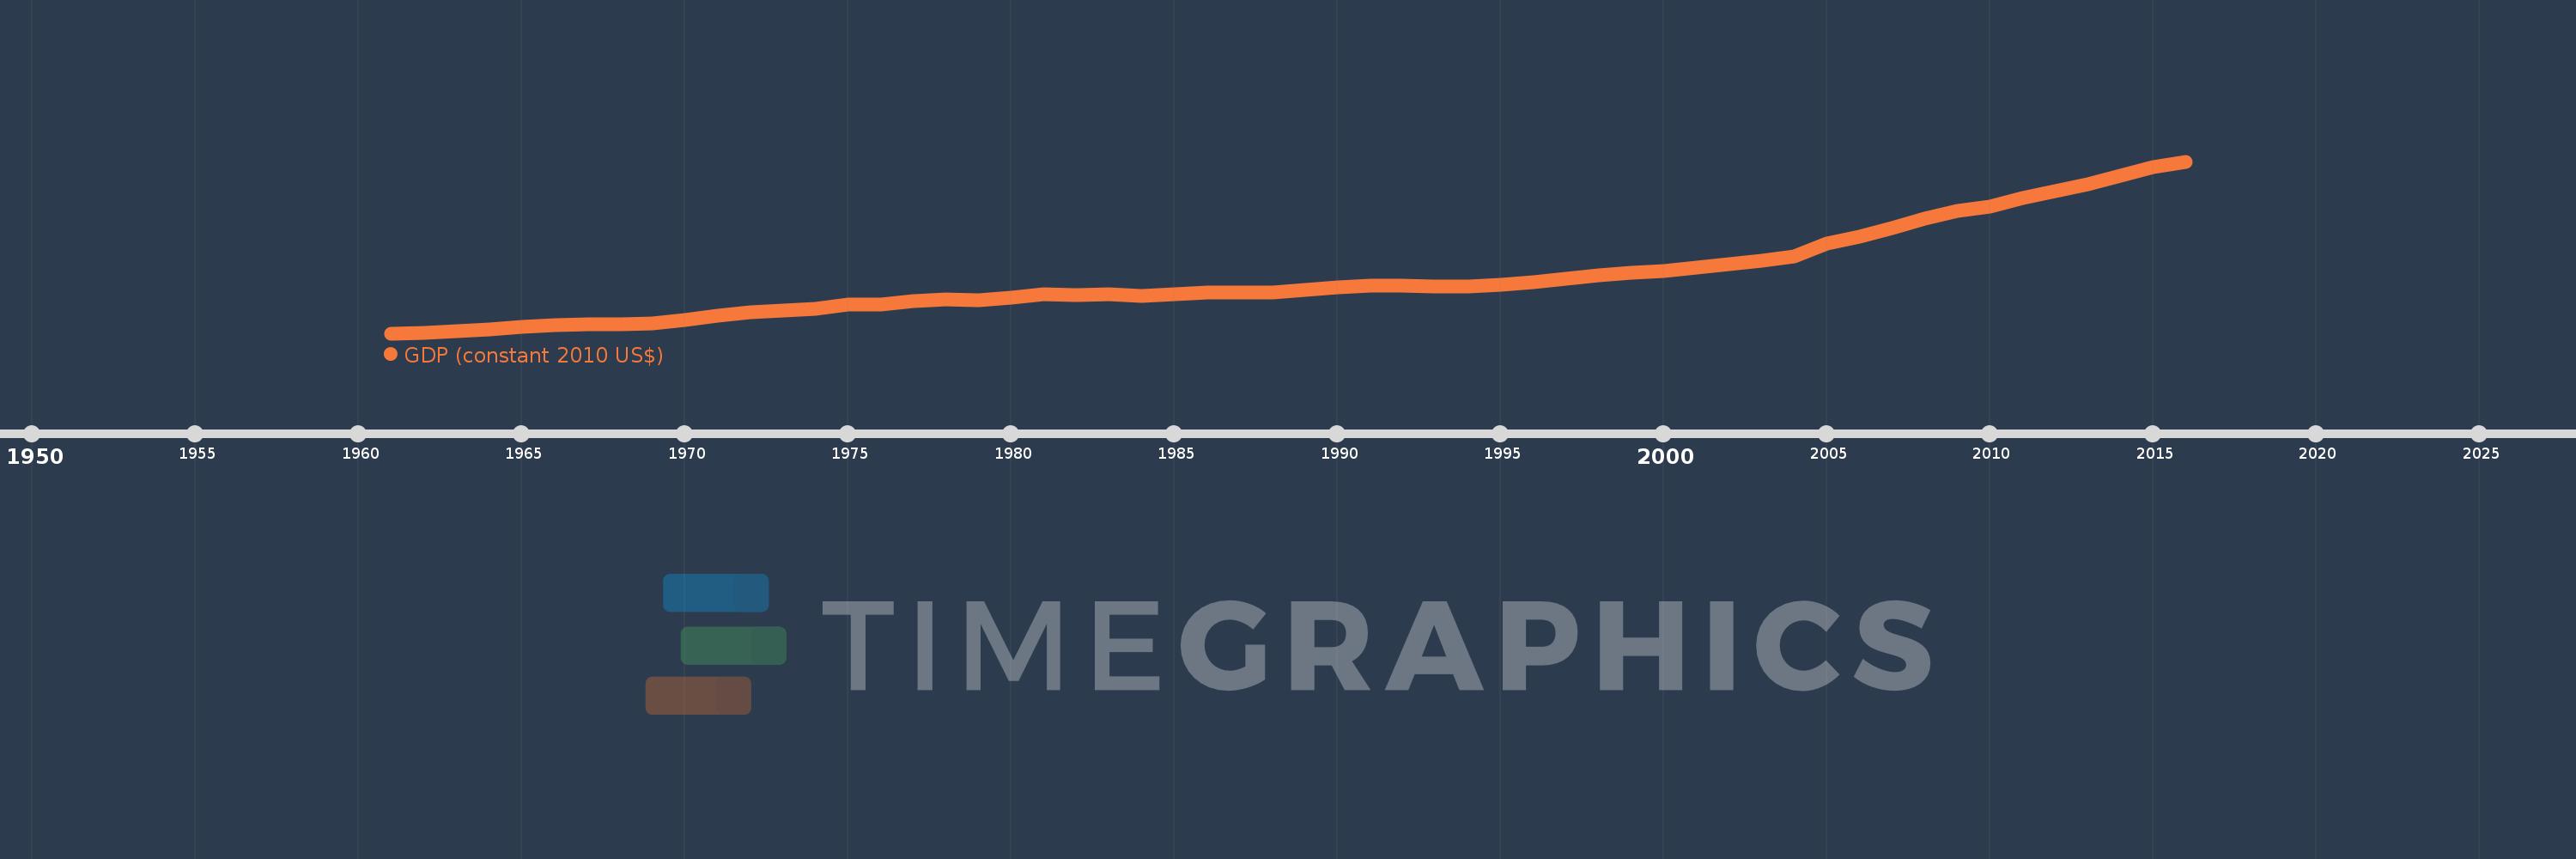
GDP (constant 2010 US$)
2016,2015,2014,2013,2012,2011,2010,2009,2008,2007,2006,2005,2004,2003,2002,2001,2000,1999,1998,1997,1996,1995,1994,1993,1992,1991,1990,1989,1988,1987,1986,1985,1984,1983,1982,1981,1980,1979,1978,1977,1976,1975,1974,1973,1972,1971,1970,1969,1968,1967,1966,1965,1964,1963,1962,1961
This statistics in other country:
AfghanistanAlbaniaAlgeriaAndorraAngolaAntigua and BarbudaArab WorldArgentinaArmeniaArubaAustraliaAustriaAzerbaijanBahamas, TheBahrainBangladeshBarbadosBelarusBelgiumBelizeBeninBermudaBhutanBoliviaBosnia and HerzegovinaBotswanaBrazilBrunei DarussalamBulgariaBurkina FasoBurundiCabo VerdeCambodiaCameroonCanadaCaribbean small statesCentral African RepublicCentral Europe and the BalticsChadChileChinaColombiaComorosCongo, Dem. Rep.Congo, Rep.Costa RicaCote d'IvoireCroatiaCubaCyprusCzech RepublicDenmarkDjiboutiDominicaDominican RepublicEarly-demographic dividendEast Asia & PacificEast Asia & Pacific (excluding high income)East Asia & Pacific (IDA & IBRD countries)EcuadorEgypt, Arab Rep.El SalvadorEquatorial GuineaEritreaEstoniaEthiopiaEuro areaEurope & Central AsiaEurope & Central Asia (excluding high income)Europe & Central Asia (IDA & IBRD countries)European UnionFaroe IslandsFijiFinlandFragile and conflict affected situationsFranceGabonGambia, TheGeorgiaGermanyGhanaGreeceGreenlandGrenadaGuatemalaGuineaGuinea-BissauGuyanaHaitiHeavily indebted poor countries (HIPC)High incomeHondurasHong Kong SAR, ChinaHungaryIBRD onlyIcelandIDA & IBRD totalIDA blendIDA onlyIDA totalIndiaIndonesiaIran, Islamic Rep.IraqIrelandIsle of ManIsraelItalyJamaicaJapanJordanKazakhstanKenyaKiribatiKorea, Rep.KosovoKuwaitKyrgyz RepublicLao PDRLate-demographic dividendLatin America & Caribbean Latin America & Caribbean (excluding high income)Latin America & the Caribbean (IDA & IBRD countries)LatviaLeast developed countries: UN classificationLebanonLesothoLiberiaLibyaLiechtensteinLithuaniaLow & middle incomeLow incomeLower middle incomeLuxembourgMacao SAR, ChinaMacedonia, FYRMadagascarMalawiMalaysiaMaldivesMaliMaltaMarshall IslandsMauritaniaMauritiusMexicoMicronesia, Fed. Sts.Middle East & North AfricaMiddle East & North Africa (excluding high income)Middle East & North Africa (IDA & IBRD countries)Middle incomeMoldovaMonacoMongoliaMontenegroMoroccoMozambiqueMyanmarNamibiaNauruNepalNetherlandsNew ZealandNicaraguaNigerNigeriaNorth AmericaNorwayOECD membersOmanOther small statesPacific island small statesPakistanPalauPanamaPapua New GuineaParaguayPeruPhilippinesPolandPortugalPost-demographic dividendPre-demographic dividendPuerto RicoQatarRomaniaRussian FederationRwandaSamoaSao Tome and PrincipeSaudi ArabiaSenegalSerbiaSeychellesSierra LeoneSingaporeSlovak RepublicSloveniaSmall statesSolomon IslandsSouth AfricaSouth AsiaSouth Asia (IDA & IBRD)South SudanSpainSri LankaSt. Kitts and NevisSt. LuciaSt. Vincent and the GrenadinesSub-Saharan Africa Sub-Saharan Africa (excluding high income)Sub-Saharan Africa (IDA & IBRD countries)SudanSurinameSwazilandSwedenSwitzerlandTajikistanTanzaniaThailandTimor-LesteTogoTongaTrinidad and TobagoTunisiaTurkeyTurkmenistanTuvaluUgandaUkraineUnited Arab EmiratesUnited KingdomUnited StatesUpper middle incomeUruguayUzbekistanVanuatuVenezuela, RBVietnamWest Bank and GazaWorldYemen, Rep.ZambiaZimbabwe Timeline:
This timeline shows a graph from 1961 to 2016 of Sub-Saharan Africa (IDA & IBRD countries). No data until 1960. Number of actual observations by date: 56.
Source name:
World Development Indicators
Source organization:
World Bank national accounts data, and OECD National Accounts data files.
Categories, topics:
Economy & Growth
Last updated:
apr 23, 2017
Indicators value changes by year
Minimum:
245.259 bln
jan 1, 1961
Maximum:
1.662 trl
jan 1, 2016
At the date of observation
Value
Absolute change
Change from previous value
jan 1, 1961
245.259 bln
+245.259 bln
0.0%
jan 1, 1962
248.889 bln
+3.63 bln
1.48%
jan 1, 1963
263.444 bln
+14.555 bln
5.85%
jan 1, 1964
280.048 bln
+16.604 bln
6.3%
jan 1, 1965
295.124 bln
+15.076 bln
5.38%
jan 1, 1966
312.948 bln
+17.824 bln
6.04%
jan 1, 1967
318.014 bln
+5.067 bln
1.62%
jan 1, 1968
316.872 bln
-1.142 bln
-0.36%
jan 1, 1969
326.537 bln
+9.665 bln
3.05%
jan 1, 1970
355.712 bln
+29.175 bln
8.93%
jan 1, 1971
390.772 bln
+35.06 bln
9.86%
jan 1, 1972
419.872 bln
+29.1 bln
7.45%
jan 1, 1973
431.049 bln
+11.177 bln
2.66%
jan 1, 1974
449.787 bln
+18.738 bln
4.35%
jan 1, 1975
485.267 bln
+35.48 bln
7.89%
jan 1, 1976
485.078 bln
-188.506 mln
-0.04%
jan 1, 1977
510.671 bln
+25.593 bln
5.28%
jan 1, 1978
522.722 bln
+12.051 bln
2.36%
jan 1, 1979
521.432 bln
-1.291 bln
-0.25%
jan 1, 1980
542.47 bln
+21.038 bln
4.03%
jan 1, 1981
564.185 bln
+21.715 bln
4.0%
jan 1, 1982
563.388 bln
-797.002 mln
-0.14%
jan 1, 1983
564.677 bln
+1.289 bln
0.23%
jan 1, 1984
556.416 bln
-8.261 bln
-1.46%
jan 1, 1985
568.305 bln
+11.889 bln
2.14%
jan 1, 1986
580.92 bln
+12.615 bln
2.22%
jan 1, 1987
578.487 bln
-2.433 bln
-0.42%
jan 1, 1988
578.874 bln
+387.738 mln
0.07%
jan 1, 1989
604.492 bln
+25.618 bln
4.43%
jan 1, 1990
624.328 bln
+19.836 bln
3.28%
jan 1, 1991
639.403 bln
+15.074 bln
2.41%
jan 1, 1992
639.799 bln
+396.543 mln
0.06%
jan 1, 1993
630.742 bln
-9.057 bln
-1.42%
jan 1, 1994
630.499 bln
-242.688 mln
-0.04%
jan 1, 1995
642.537 bln
+12.038 bln
1.91%
jan 1, 1996
663.262 bln
+20.725 bln
3.23%
jan 1, 1997
698.166 bln
+34.904 bln
5.26%
jan 1, 1998
723.538 bln
+25.371 bln
3.63%
jan 1, 1999
741.598 bln
+18.06 bln
2.5%
jan 1, 2000
757.92 bln
+16.322 bln
2.2%
jan 1, 2001
785.391 bln
+27.472 bln
3.62%
jan 1, 2002
816.33 bln
+30.939 bln
3.94%
jan 1, 2003
840.61 bln
+24.28 bln
2.97%
jan 1, 2004
881.587 bln
+40.976 bln
4.87%
jan 1, 2005
984.267 bln
+102.68 bln
11.65%
jan 1, 2006
1.039 trl
+54.649 bln
5.55%
jan 1, 2007
1.112 trl
+73.252 bln
7.05%
jan 1, 2008
1.191 trl
+78.64 bln
7.07%
jan 1, 2009
1.255 trl
+64.219 bln
5.39%
jan 1, 2010
1.291 trl
+35.814 bln
2.85%
jan 1, 2011
1.36 trl
+69.634 bln
5.39%
jan 1, 2012
1.419 trl
+58.828 bln
4.32%
jan 1, 2013
1.472 trl
+52.788 bln
3.72%
jan 1, 2014
1.542 trl
+70.109 bln
4.76%
jan 1, 2015
1.613 trl
+70.814 bln
4.59%
jan 1, 2016
1.662 trl
+48.602 bln
3.01%
Ranking of countries by current statistics by years


Comments: