29
/
en
AIzaSyAYiBZKx7MnpbEhh9jyipgxe19OcubqV5w
April 1, 2024
84756
Benin
BEN
true
2
1
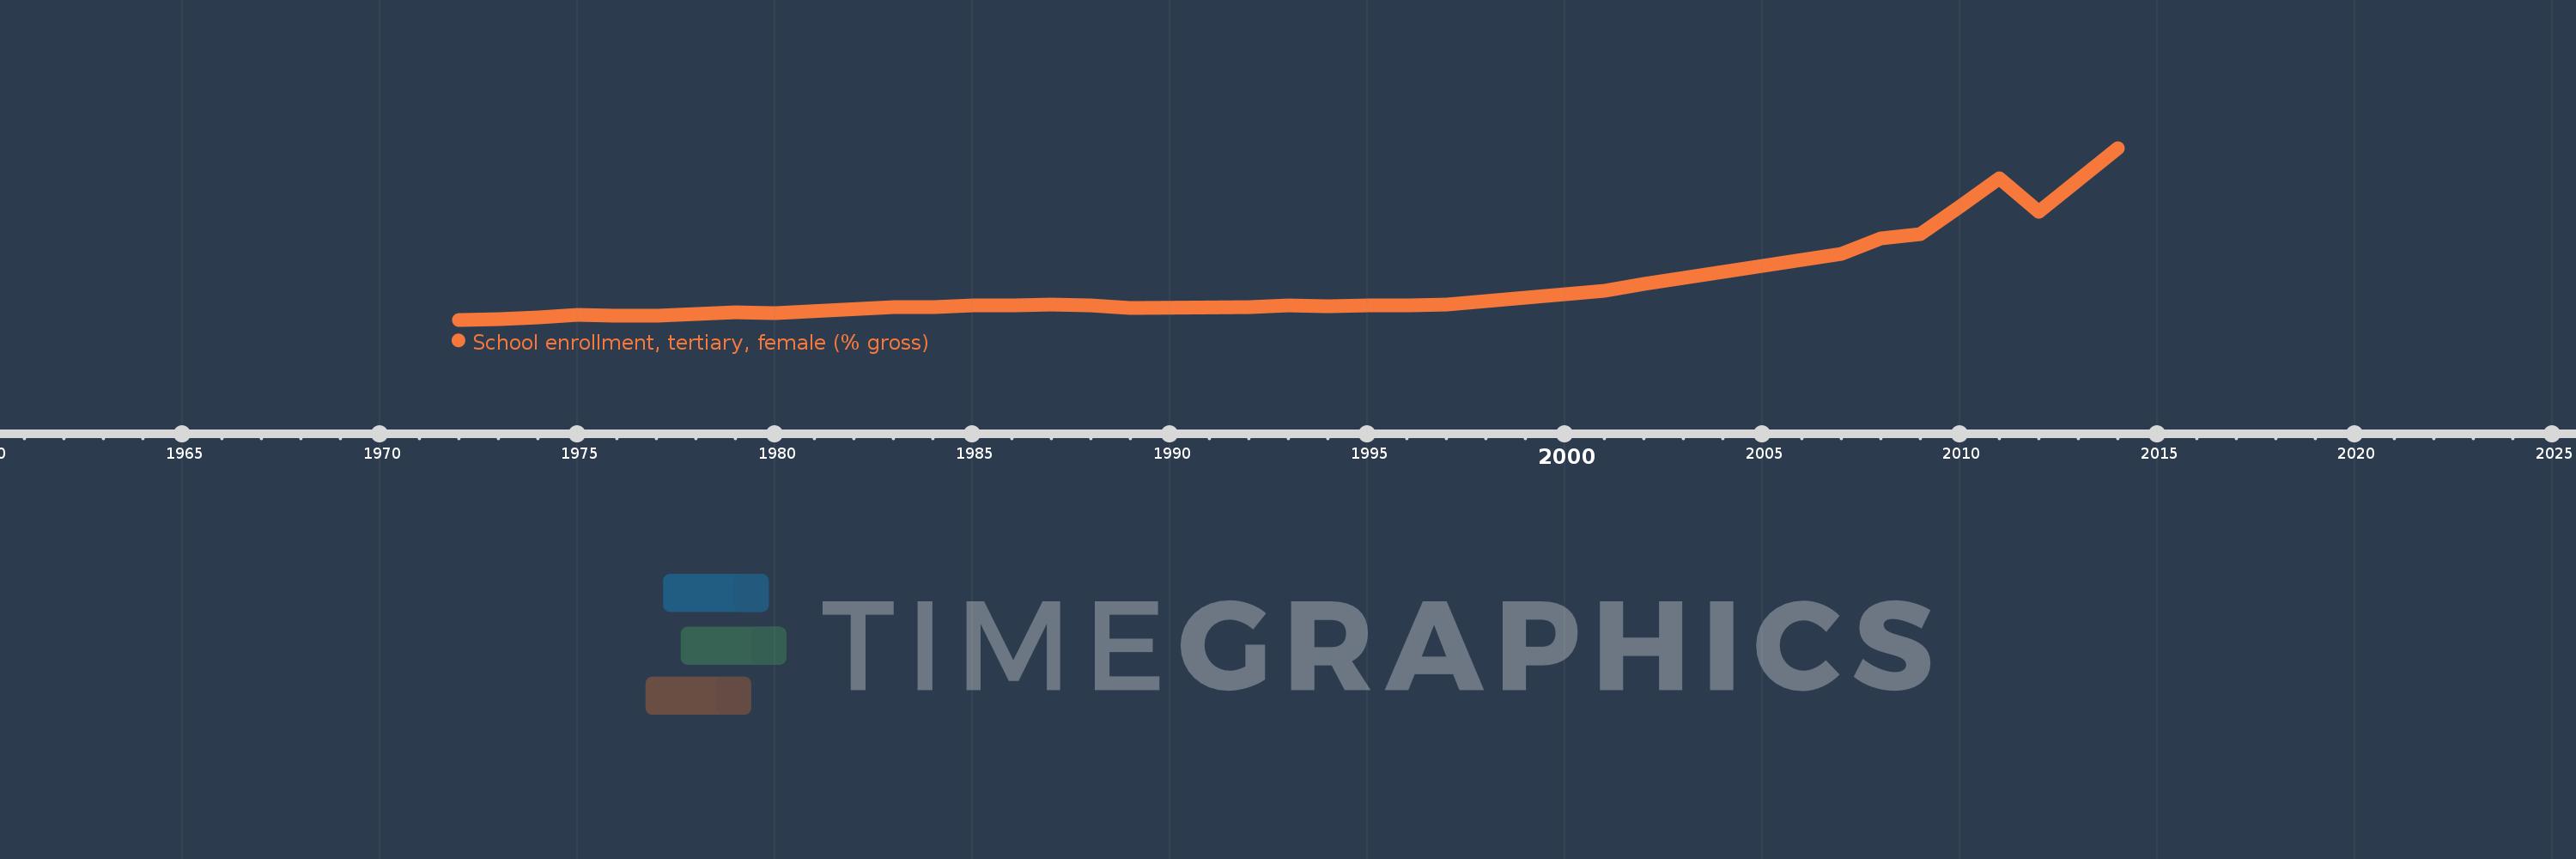
School enrollment, tertiary, female (% gross)
2014,2013,2012,2011,2010,2009,2008,2007,2002,2001,2000,1998,1997,1996,1995,1994,1993,1992,1989,1988,1987,1986,1985,1984,1983,1980,1979,1977,1976,1975,1974,1973,1972
This statistics in other country:
AfghanistanAlbaniaAlgeriaAngolaAntigua and BarbudaArab WorldArgentinaArmeniaArubaAustraliaAustriaAzerbaijanBahamas, TheBahrainBangladeshBarbadosBelarusBelgiumBelizeBeninBermudaBhutanBoliviaBosnia and HerzegovinaBotswanaBrazilBrunei DarussalamBulgariaBurkina FasoBurundiCabo VerdeCambodiaCameroonCanadaCaribbean small statesCentral African RepublicCentral Europe and the BalticsChadChileChinaColombiaComorosCongo, Dem. Rep.Congo, Rep.Costa RicaCote d'IvoireCroatiaCubaCuracaoCyprusCzech RepublicDenmarkDjiboutiDominicaDominican RepublicEarly-demographic dividendEast Asia & PacificEast Asia & Pacific (excluding high income)East Asia & Pacific (IDA & IBRD countries)EcuadorEgypt, Arab Rep.El SalvadorEquatorial GuineaEritreaEstoniaEthiopiaEuro areaEurope & Central AsiaEurope & Central Asia (excluding high income)Europe & Central Asia (IDA & IBRD countries)European UnionFijiFinlandFragile and conflict affected situationsFranceGabonGambia, TheGeorgiaGermanyGhanaGreeceGrenadaGuatemalaGuineaGuinea-BissauGuyanaHaitiHeavily indebted poor countries (HIPC)High incomeHondurasHong Kong SAR, ChinaHungaryIBRD onlyIcelandIDA & IBRD totalIDA blendIDA onlyIDA totalIndiaIndonesiaIran, Islamic Rep.IraqIrelandIsraelItalyJamaicaJapanJordanKazakhstanKenyaKorea, Dem. People’s Rep.Korea, Rep.KuwaitKyrgyz RepublicLao PDRLate-demographic dividendLatin America & Caribbean Latin America & Caribbean (excluding high income)Latin America & the Caribbean (IDA & IBRD countries)LatviaLeast developed countries: UN classificationLebanonLesothoLiberiaLibyaLiechtensteinLithuaniaLow & middle incomeLow incomeLower middle incomeLuxembourgMacao SAR, ChinaMacedonia, FYRMadagascarMalawiMaldivesMaliMaltaMarshall IslandsMauritaniaMauritiusMexicoMicronesia, Fed. Sts.Middle East & North AfricaMiddle East & North Africa (excluding high income)Middle East & North Africa (IDA & IBRD countries)Middle incomeMoldovaMongoliaMontenegroMoroccoMozambiqueMyanmarNamibiaNepalNetherlandsNew ZealandNicaraguaNigerNigeriaNorth AmericaNorwayOECD membersOmanOther small statesPacific island small statesPakistanPalauPanamaPapua New GuineaParaguayPeruPhilippinesPolandPortugalPost-demographic dividendPre-demographic dividendPuerto RicoQatarRomaniaRussian FederationRwandaSamoaSan MarinoSao Tome and PrincipeSaudi ArabiaSenegalSerbiaSeychellesSierra LeoneSingaporeSlovak RepublicSloveniaSmall statesSomaliaSouth AfricaSouth AsiaSouth Asia (IDA & IBRD)SpainSri LankaSt. Kitts and NevisSt. LuciaSt. Vincent and the GrenadinesSub-Saharan Africa Sub-Saharan Africa (excluding high income)Sub-Saharan Africa (IDA & IBRD countries)SudanSurinameSwazilandSwedenSwitzerlandSyrian Arab RepublicTajikistanTanzaniaThailandTimor-LesteTogoTongaTrinidad and TobagoTunisiaTurkeyTurkmenistanUgandaUkraineUnited Arab EmiratesUnited KingdomUnited StatesUpper middle incomeUruguayUzbekistanVanuatuVenezuela, RBVietnamWest Bank and GazaWorldYemen, Rep.ZambiaZimbabwe Timeline:
This timeline shows a graph from 1972 to 2014 of Benin. No data until 1971. Number of actual observations by date: 33.
Source name:
World Development Indicators
Source organization:
United Nations Educational, Scientific, and Cultural Organization (UNESCO) Institute for Statistics.
Categories, topics:
Education, Gender
Last updated:
apr 23, 2017
Indicators value changes by year
At the date of observation
Value
Absolute change
Change from previous value
jan 1, 1972
0.018
+0.018
0.0%
jan 1, 1973
0.066
+0.048
262.76%
jan 1, 1974
0.124
+0.058
88.5%
jan 1, 1975
0.244
+0.121
97.51%
jan 1, 1976
0.207
-0.037
-15.18%
jan 1, 1977
0.221
+0.013
6.45%
jan 1, 1979
0.385
+0.164
74.45%
jan 1, 1980
0.34
-0.045
-11.74%
jan 1, 1983
0.635
+0.295
86.74%
jan 1, 1984
0.613
-0.022
-3.4%
jan 1, 1985
0.696
+0.082
13.45%
jan 1, 1986
0.699
+0.003
0.47%
jan 1, 1987
0.74
+0.041
5.93%
jan 1, 1988
0.701
-0.039
-5.24%
jan 1, 1989
0.602
-0.1
-14.25%
jan 1, 1992
0.62
+0.018
3.04%
jan 1, 1993
0.698
+0.078
12.53%
jan 1, 1994
0.662
-0.036
-5.1%
jan 1, 1995
0.715
+0.053
8.06%
jan 1, 1996
0.715
+0.0
0.0%
jan 1, 1997
0.744
+0.029
4.04%
jan 1, 1998
0.937
+0.193
25.91%
jan 1, 2000
1.262
+0.325
34.7%
jan 1, 2001
1.438
+0.176
13.94%
jan 1, 2002
1.746
+0.308
21.39%
jan 1, 2007
3.217
+1.472
84.28%
jan 1, 2008
3.989
+0.772
23.99%
jan 1, 2009
4.194
+0.205
5.13%
jan 1, 2010
5.511
+1.317
31.4%
jan 1, 2011
6.887
+1.376
24.97%
jan 1, 2012
5.253
-1.635
-23.73%
jan 1, 2013
6.825
+1.573
29.94%
jan 1, 2014
8.374
+1.549
22.69%
Ranking of countries by current statistics by years


Comments: