29
/
en
AIzaSyAYiBZKx7MnpbEhh9jyipgxe19OcubqV5w
April 1, 2024
258963
Syrian Arab Republic
SYR
true
2
1
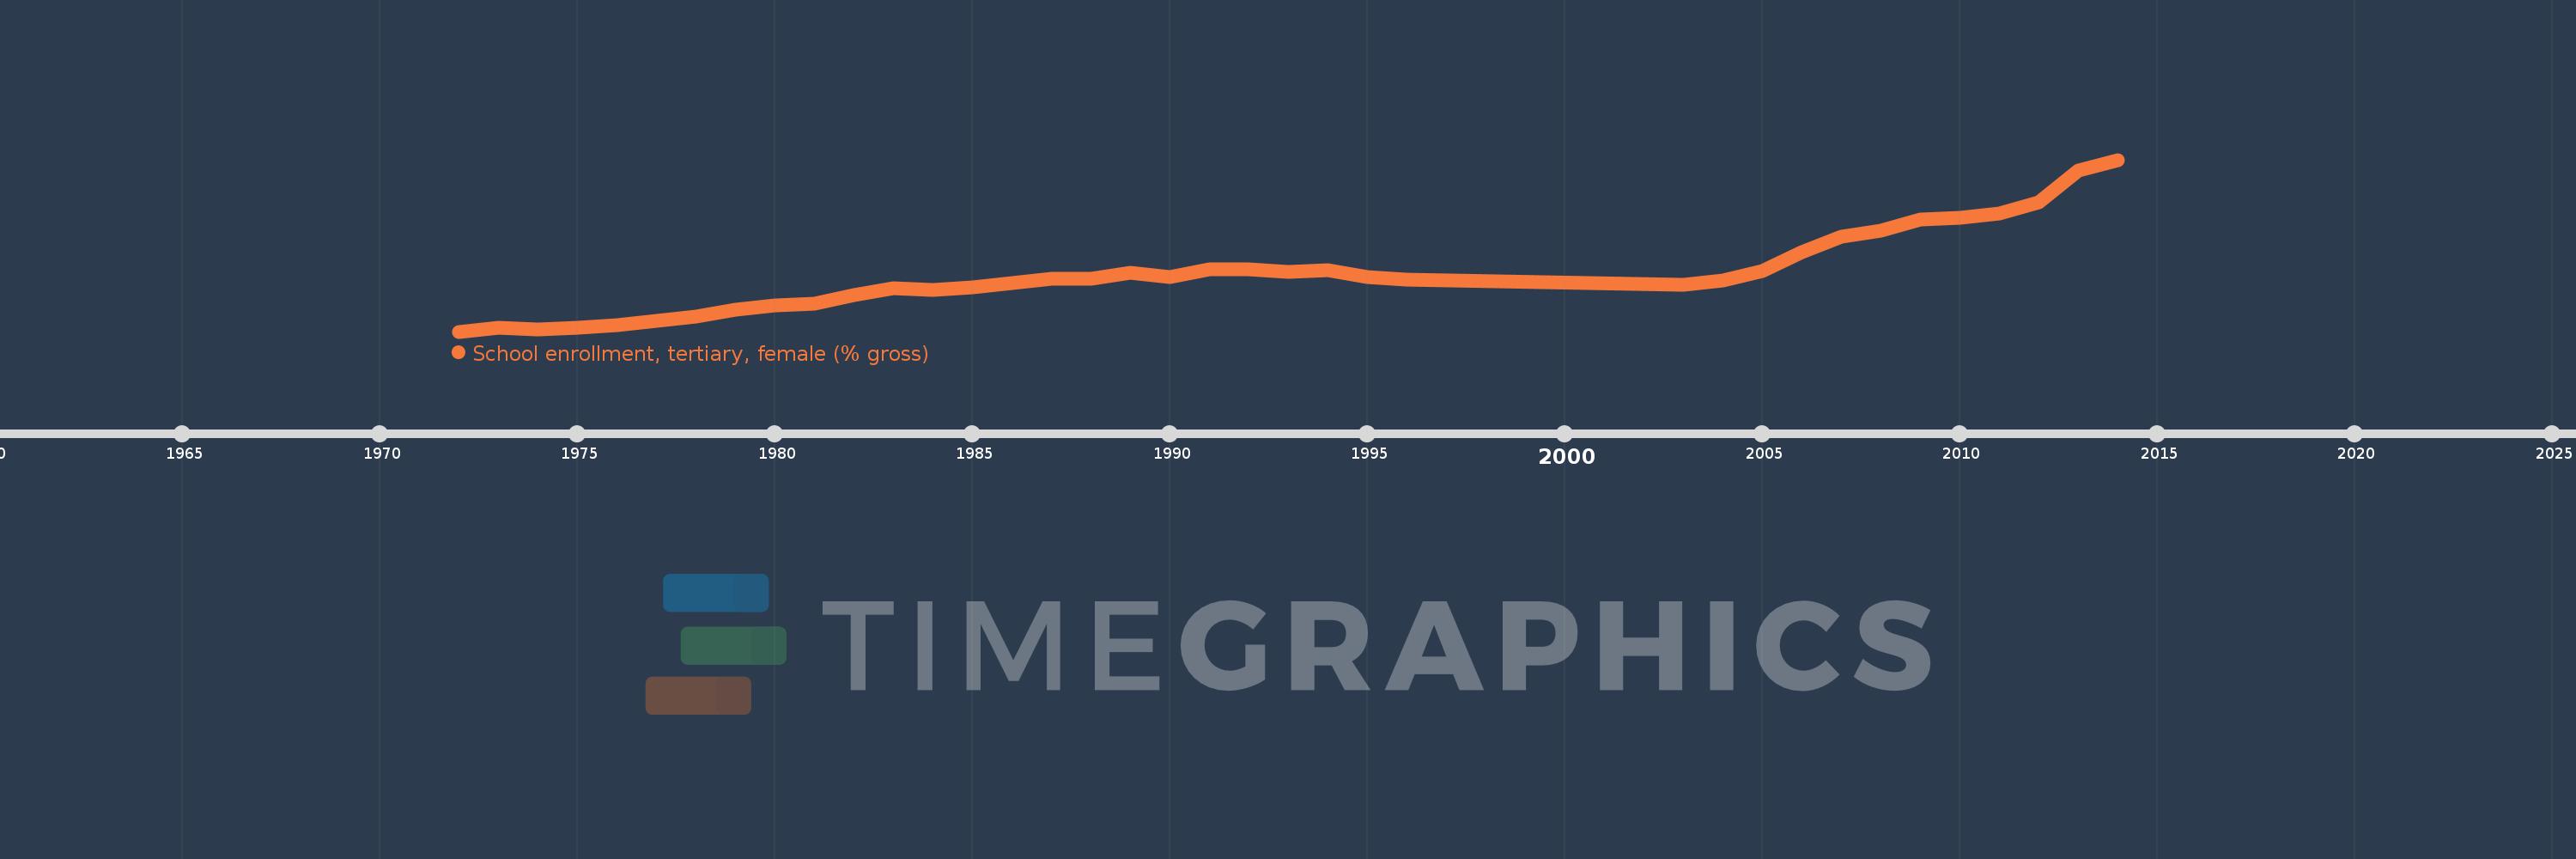
School enrollment, tertiary, female (% gross)
2014,2013,2012,2011,2010,2009,2008,2007,2006,2005,2004,2003,1996,1995,1994,1993,1992,1991,1990,1989,1988,1987,1986,1985,1984,1983,1982,1981,1980,1979,1978,1977,1976,1975,1974,1973,1972
This statistics in other country:
AfghanistanAlbaniaAlgeriaAngolaAntigua and BarbudaArab WorldArgentinaArmeniaArubaAustraliaAustriaAzerbaijanBahamas, TheBahrainBangladeshBarbadosBelarusBelgiumBelizeBeninBermudaBhutanBoliviaBosnia and HerzegovinaBotswanaBrazilBrunei DarussalamBulgariaBurkina FasoBurundiCabo VerdeCambodiaCameroonCanadaCaribbean small statesCentral African RepublicCentral Europe and the BalticsChadChileChinaColombiaComorosCongo, Dem. Rep.Congo, Rep.Costa RicaCote d'IvoireCroatiaCubaCuracaoCyprusCzech RepublicDenmarkDjiboutiDominicaDominican RepublicEarly-demographic dividendEast Asia & PacificEast Asia & Pacific (excluding high income)East Asia & Pacific (IDA & IBRD countries)EcuadorEgypt, Arab Rep.El SalvadorEquatorial GuineaEritreaEstoniaEthiopiaEuro areaEurope & Central AsiaEurope & Central Asia (excluding high income)Europe & Central Asia (IDA & IBRD countries)European UnionFijiFinlandFragile and conflict affected situationsFranceGabonGambia, TheGeorgiaGermanyGhanaGreeceGrenadaGuatemalaGuineaGuinea-BissauGuyanaHaitiHeavily indebted poor countries (HIPC)High incomeHondurasHong Kong SAR, ChinaHungaryIBRD onlyIcelandIDA & IBRD totalIDA blendIDA onlyIDA totalIndiaIndonesiaIran, Islamic Rep.IraqIrelandIsraelItalyJamaicaJapanJordanKazakhstanKenyaKorea, Dem. People’s Rep.Korea, Rep.KuwaitKyrgyz RepublicLao PDRLate-demographic dividendLatin America & Caribbean Latin America & Caribbean (excluding high income)Latin America & the Caribbean (IDA & IBRD countries)LatviaLeast developed countries: UN classificationLebanonLesothoLiberiaLibyaLiechtensteinLithuaniaLow & middle incomeLow incomeLower middle incomeLuxembourgMacao SAR, ChinaMacedonia, FYRMadagascarMalawiMaldivesMaliMaltaMarshall IslandsMauritaniaMauritiusMexicoMicronesia, Fed. Sts.Middle East & North AfricaMiddle East & North Africa (excluding high income)Middle East & North Africa (IDA & IBRD countries)Middle incomeMoldovaMongoliaMontenegroMoroccoMozambiqueMyanmarNamibiaNepalNetherlandsNew ZealandNicaraguaNigerNigeriaNorth AmericaNorwayOECD membersOmanOther small statesPacific island small statesPakistanPalauPanamaPapua New GuineaParaguayPeruPhilippinesPolandPortugalPost-demographic dividendPre-demographic dividendPuerto RicoQatarRomaniaRussian FederationRwandaSamoaSan MarinoSao Tome and PrincipeSaudi ArabiaSenegalSerbiaSeychellesSierra LeoneSingaporeSlovak RepublicSloveniaSmall statesSomaliaSouth AfricaSouth AsiaSouth Asia (IDA & IBRD)SpainSri LankaSt. Kitts and NevisSt. LuciaSt. Vincent and the GrenadinesSub-Saharan Africa Sub-Saharan Africa (excluding high income)Sub-Saharan Africa (IDA & IBRD countries)SudanSurinameSwazilandSwedenSwitzerlandSyrian Arab RepublicTajikistanTanzaniaThailandTimor-LesteTogoTongaTrinidad and TobagoTunisiaTurkeyTurkmenistanUgandaUkraineUnited Arab EmiratesUnited KingdomUnited StatesUpper middle incomeUruguayUzbekistanVanuatuVenezuela, RBVietnamWest Bank and GazaWorldYemen, Rep.ZambiaZimbabwe Timeline:
This timeline shows a graph from 1972 to 2014 of Syrian Arab Republic. No data until 1971. Number of actual observations by date: 37.
Source name:
World Development Indicators
Source organization:
United Nations Educational, Scientific, and Cultural Organization (UNESCO) Institute for Statistics.
Categories, topics:
Education, Gender
Last updated:
apr 23, 2017
Indicators value changes by year
Maximum:
33.571
jan 1, 2014
At the date of observation
Value
Absolute change
Change from previous value
jan 1, 1972
3.051
+3.051
0.0%
jan 1, 1973
3.72
+0.669
21.94%
jan 1, 1974
3.373
-0.347
-9.32%
jan 1, 1975
3.669
+0.296
8.76%
jan 1, 1976
4.268
+0.599
16.33%
jan 1, 1977
4.95
+0.681
15.96%
jan 1, 1978
5.74
+0.79
15.96%
jan 1, 1979
6.947
+1.208
21.04%
jan 1, 1980
7.761
+0.814
11.71%
jan 1, 1981
8.048
+0.287
3.7%
jan 1, 1982
9.594
+1.546
19.21%
jan 1, 1983
10.713
+1.119
11.66%
jan 1, 1984
10.418
-0.295
-2.75%
jan 1, 1985
10.936
+0.518
4.97%
jan 1, 1986
11.659
+0.724
6.62%
jan 1, 1987
12.368
+0.709
6.08%
jan 1, 1988
12.414
+0.046
0.37%
jan 1, 1989
13.472
+1.058
8.52%
jan 1, 1990
12.804
-0.667
-4.95%
jan 1, 1991
14.077
+1.273
9.94%
jan 1, 1992
14.096
+0.019
0.14%
jan 1, 1993
13.624
-0.473
-3.35%
jan 1, 1994
13.979
+0.355
2.6%
jan 1, 1995
12.768
-1.211
-8.66%
jan 1, 1996
12.304
-0.463
-3.63%
jan 1, 2003
11.422
-0.882
-7.17%
jan 1, 2004
12.186
+0.764
6.68%
jan 1, 2005
13.745
+1.559
12.79%
jan 1, 2006
17.175
+3.43
24.95%
jan 1, 2007
19.985
+2.811
16.36%
jan 1, 2008
21.034
+1.049
5.25%
jan 1, 2009
22.897
+1.863
8.86%
jan 1, 2010
23.304
+0.407
1.78%
jan 1, 2011
24.062
+0.757
3.25%
jan 1, 2012
26.076
+2.015
8.37%
jan 1, 2013
31.671
+5.595
21.46%
jan 1, 2014
33.571
+1.9
6.0%
Ranking of countries by current statistics by years


Comments: