29
/
en
AIzaSyAYiBZKx7MnpbEhh9jyipgxe19OcubqV5w
April 1, 2024
53794
Other small states
OSS
false
2
1
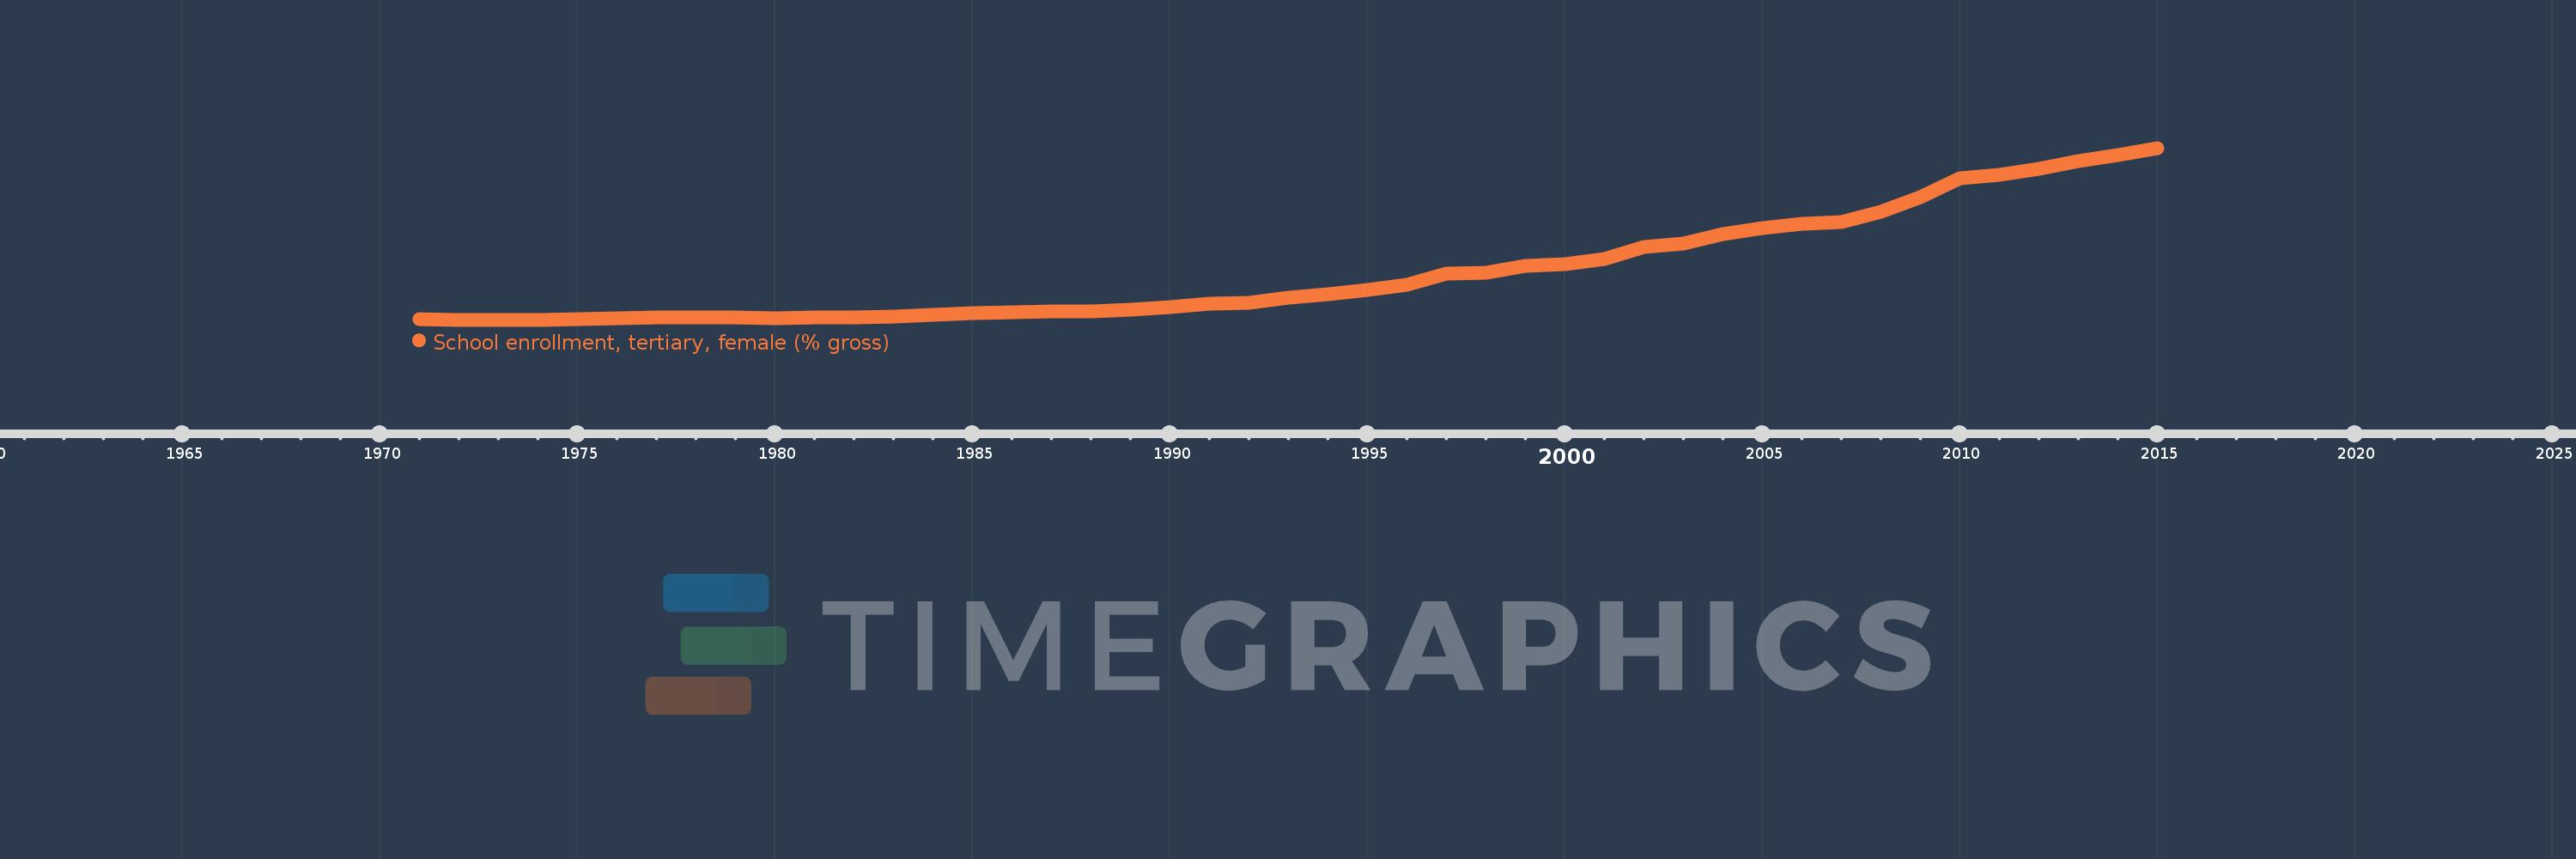
School enrollment, tertiary, female (% gross)
2015,2014,2013,2012,2011,2010,2009,2008,2007,2006,2005,2004,2003,2002,2001,2000,1999,1998,1997,1996,1995,1994,1993,1992,1991,1990,1989,1988,1987,1986,1985,1984,1983,1982,1981,1980,1979,1978,1977,1976,1975,1974,1973,1972,1971
This statistics in other country:
AfghanistanAlbaniaAlgeriaAngolaAntigua and BarbudaArab WorldArgentinaArmeniaArubaAustraliaAustriaAzerbaijanBahamas, TheBahrainBangladeshBarbadosBelarusBelgiumBelizeBeninBermudaBhutanBoliviaBosnia and HerzegovinaBotswanaBrazilBrunei DarussalamBulgariaBurkina FasoBurundiCabo VerdeCambodiaCameroonCanadaCaribbean small statesCentral African RepublicCentral Europe and the BalticsChadChileChinaColombiaComorosCongo, Dem. Rep.Congo, Rep.Costa RicaCote d'IvoireCroatiaCubaCuracaoCyprusCzech RepublicDenmarkDjiboutiDominicaDominican RepublicEarly-demographic dividendEast Asia & PacificEast Asia & Pacific (excluding high income)East Asia & Pacific (IDA & IBRD countries)EcuadorEgypt, Arab Rep.El SalvadorEquatorial GuineaEritreaEstoniaEthiopiaEuro areaEurope & Central AsiaEurope & Central Asia (excluding high income)Europe & Central Asia (IDA & IBRD countries)European UnionFijiFinlandFragile and conflict affected situationsFranceGabonGambia, TheGeorgiaGermanyGhanaGreeceGrenadaGuatemalaGuineaGuinea-BissauGuyanaHaitiHeavily indebted poor countries (HIPC)High incomeHondurasHong Kong SAR, ChinaHungaryIBRD onlyIcelandIDA & IBRD totalIDA blendIDA onlyIDA totalIndiaIndonesiaIran, Islamic Rep.IraqIrelandIsraelItalyJamaicaJapanJordanKazakhstanKenyaKorea, Dem. People’s Rep.Korea, Rep.KuwaitKyrgyz RepublicLao PDRLate-demographic dividendLatin America & Caribbean Latin America & Caribbean (excluding high income)Latin America & the Caribbean (IDA & IBRD countries)LatviaLeast developed countries: UN classificationLebanonLesothoLiberiaLibyaLiechtensteinLithuaniaLow & middle incomeLow incomeLower middle incomeLuxembourgMacao SAR, ChinaMacedonia, FYRMadagascarMalawiMaldivesMaliMaltaMarshall IslandsMauritaniaMauritiusMexicoMicronesia, Fed. Sts.Middle East & North AfricaMiddle East & North Africa (excluding high income)Middle East & North Africa (IDA & IBRD countries)Middle incomeMoldovaMongoliaMontenegroMoroccoMozambiqueMyanmarNamibiaNepalNetherlandsNew ZealandNicaraguaNigerNigeriaNorth AmericaNorwayOECD membersOmanOther small statesPacific island small statesPakistanPalauPanamaPapua New GuineaParaguayPeruPhilippinesPolandPortugalPost-demographic dividendPre-demographic dividendPuerto RicoQatarRomaniaRussian FederationRwandaSamoaSan MarinoSao Tome and PrincipeSaudi ArabiaSenegalSerbiaSeychellesSierra LeoneSingaporeSlovak RepublicSloveniaSmall statesSomaliaSouth AfricaSouth AsiaSouth Asia (IDA & IBRD)SpainSri LankaSt. Kitts and NevisSt. LuciaSt. Vincent and the GrenadinesSub-Saharan Africa Sub-Saharan Africa (excluding high income)Sub-Saharan Africa (IDA & IBRD countries)SudanSurinameSwazilandSwedenSwitzerlandSyrian Arab RepublicTajikistanTanzaniaThailandTimor-LesteTogoTongaTrinidad and TobagoTunisiaTurkeyTurkmenistanUgandaUkraineUnited Arab EmiratesUnited KingdomUnited StatesUpper middle incomeUruguayUzbekistanVanuatuVenezuela, RBVietnamWest Bank and GazaWorldYemen, Rep.ZambiaZimbabwe Timeline:
This timeline shows a graph from 1971 to 2015 of Other small states. No data until 1970. Number of actual observations by date: 45.
Source name:
World Development Indicators
Source organization:
United Nations Educational, Scientific, and Cultural Organization (UNESCO) Institute for Statistics.
Categories, topics:
Education, Gender
Last updated:
apr 23, 2017
Indicators value changes by year
Maximum:
21.298
jan 1, 2015
At the date of observation
Value
Absolute change
Change from previous value
jan 1, 1971
4.919
+4.919
0.0%
jan 1, 1972
4.885
-0.034
-0.7%
jan 1, 1973
4.895
+0.01
0.2%
jan 1, 1974
4.897
+0.002
0.05%
jan 1, 1975
4.914
+0.017
0.35%
jan 1, 1976
4.987
+0.073
1.49%
jan 1, 1977
5.078
+0.091
1.82%
jan 1, 1978
5.135
+0.057
1.13%
jan 1, 1979
5.09
-0.045
-0.88%
jan 1, 1980
5.049
-0.041
-0.81%
jan 1, 1981
5.081
+0.032
0.64%
jan 1, 1982
5.103
+0.021
0.42%
jan 1, 1983
5.162
+0.06
1.17%
jan 1, 1984
5.317
+0.155
3.01%
jan 1, 1985
5.498
+0.181
3.41%
jan 1, 1986
5.622
+0.124
2.25%
jan 1, 1987
5.689
+0.067
1.19%
jan 1, 1988
5.658
-0.031
-0.54%
jan 1, 1989
5.886
+0.228
4.02%
jan 1, 1990
6.074
+0.188
3.19%
jan 1, 1991
6.423
+0.349
5.74%
jan 1, 1992
6.515
+0.093
1.45%
jan 1, 1993
6.978
+0.463
7.1%
jan 1, 1994
7.353
+0.374
5.36%
jan 1, 1995
7.753
+0.401
5.45%
jan 1, 1996
8.193
+0.44
5.68%
jan 1, 1997
9.27
+1.077
13.14%
jan 1, 1998
9.408
+0.138
1.49%
jan 1, 1999
10.011
+0.603
6.41%
jan 1, 2000
10.235
+0.224
2.24%
jan 1, 2001
10.691
+0.456
4.46%
jan 1, 2002
11.797
+1.106
10.35%
jan 1, 2003
12.152
+0.355
3.01%
jan 1, 2004
13.026
+0.875
7.2%
jan 1, 2005
13.645
+0.619
4.75%
jan 1, 2006
14.085
+0.44
3.22%
jan 1, 2007
14.22
+0.135
0.96%
jan 1, 2008
15.164
+0.943
6.63%
jan 1, 2009
16.607
+1.444
9.52%
jan 1, 2010
18.392
+1.785
10.75%
jan 1, 2011
18.692
+0.3
1.63%
jan 1, 2012
19.31
+0.619
3.31%
jan 1, 2013
20.068
+0.758
3.93%
jan 1, 2014
20.64
+0.572
2.85%
jan 1, 2015
21.298
+0.657
3.18%
Ranking of countries by current statistics by years


Comments: