29
/
en
AIzaSyAYiBZKx7MnpbEhh9jyipgxe19OcubqV5w
April 1, 2024
45658
Low & middle income
LMY
false
2
1
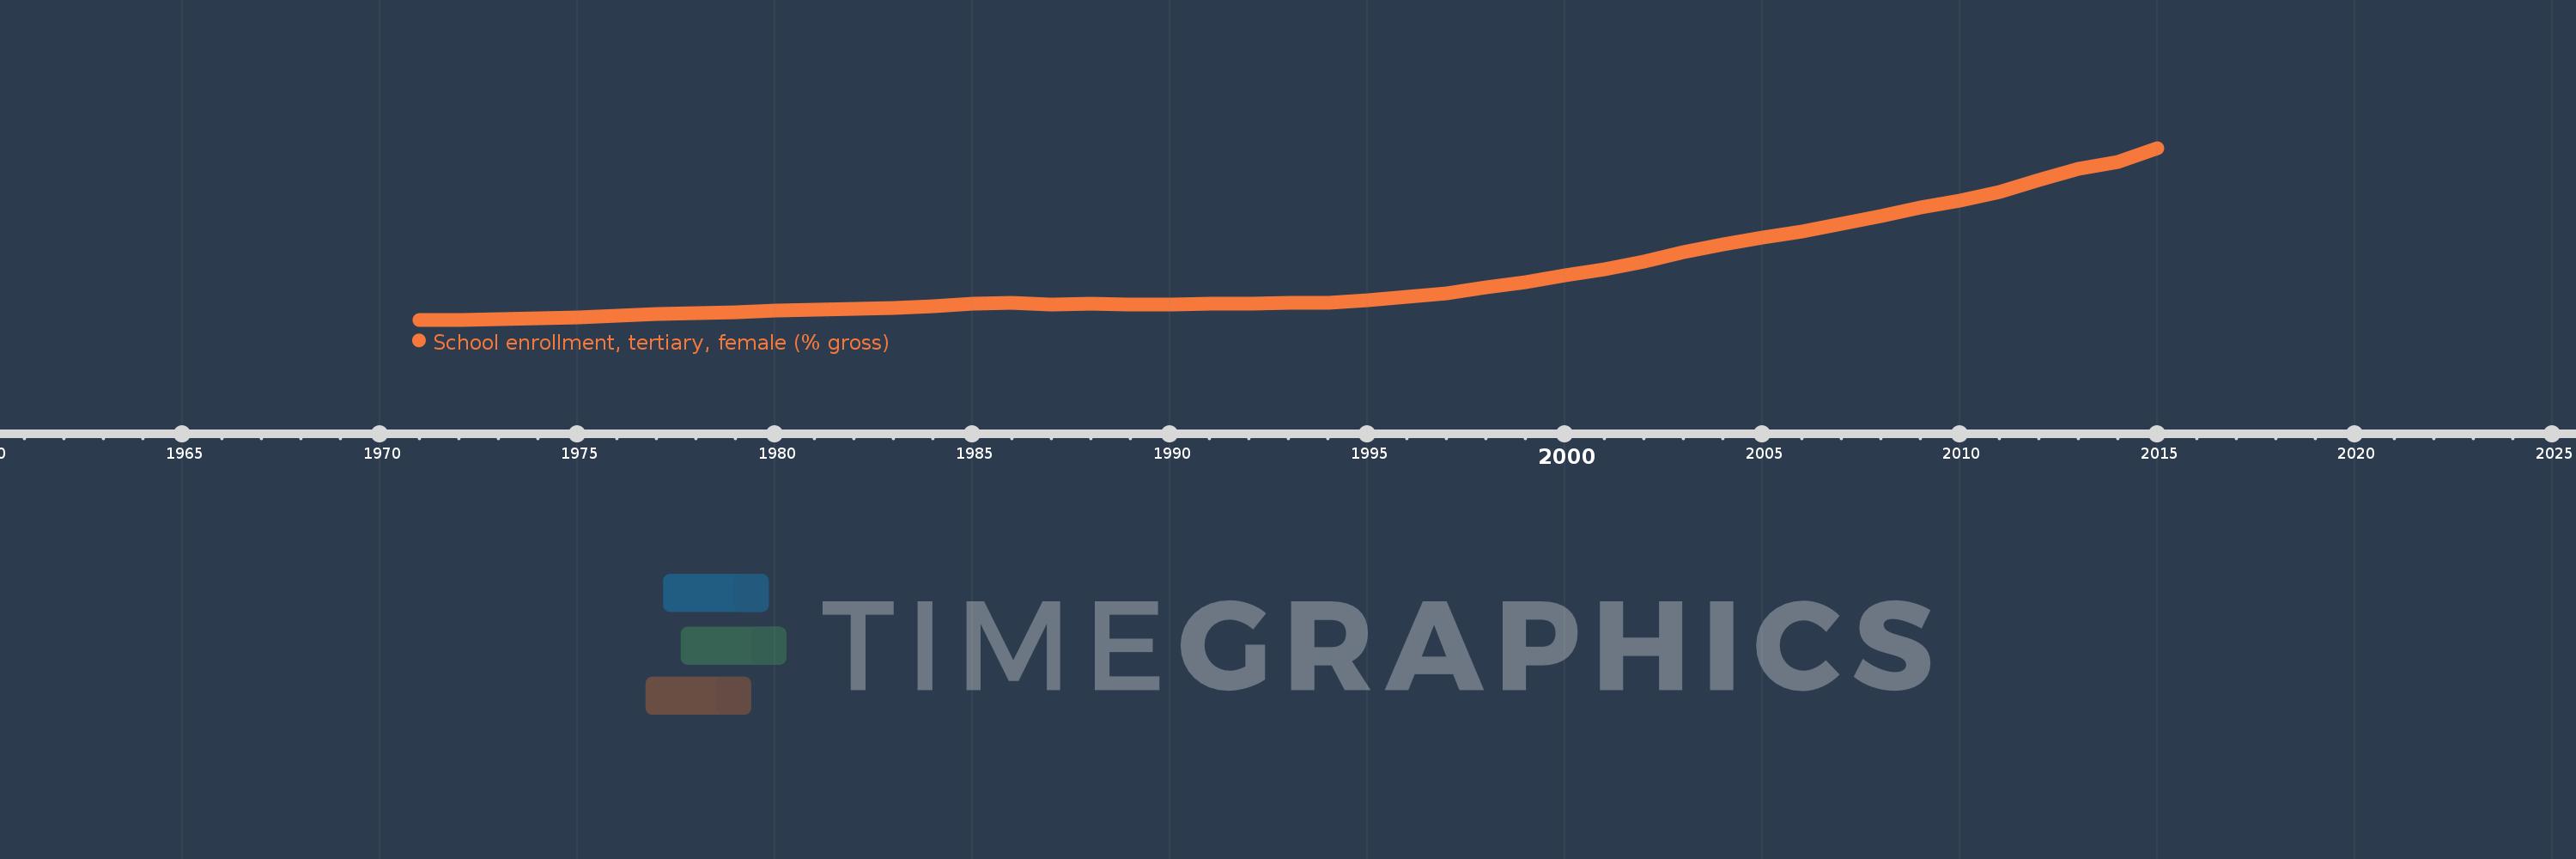
School enrollment, tertiary, female (% gross)
2015,2014,2013,2012,2011,2010,2009,2008,2007,2006,2005,2004,2003,2002,2001,2000,1999,1998,1997,1996,1995,1994,1993,1992,1991,1990,1989,1988,1987,1986,1985,1984,1983,1982,1981,1980,1979,1978,1977,1976,1975,1974,1973,1972,1971
This statistics in other country:
AfghanistanAlbaniaAlgeriaAngolaAntigua and BarbudaArab WorldArgentinaArmeniaArubaAustraliaAustriaAzerbaijanBahamas, TheBahrainBangladeshBarbadosBelarusBelgiumBelizeBeninBermudaBhutanBoliviaBosnia and HerzegovinaBotswanaBrazilBrunei DarussalamBulgariaBurkina FasoBurundiCabo VerdeCambodiaCameroonCanadaCaribbean small statesCentral African RepublicCentral Europe and the BalticsChadChileChinaColombiaComorosCongo, Dem. Rep.Congo, Rep.Costa RicaCote d'IvoireCroatiaCubaCuracaoCyprusCzech RepublicDenmarkDjiboutiDominicaDominican RepublicEarly-demographic dividendEast Asia & PacificEast Asia & Pacific (excluding high income)East Asia & Pacific (IDA & IBRD countries)EcuadorEgypt, Arab Rep.El SalvadorEquatorial GuineaEritreaEstoniaEthiopiaEuro areaEurope & Central AsiaEurope & Central Asia (excluding high income)Europe & Central Asia (IDA & IBRD countries)European UnionFijiFinlandFragile and conflict affected situationsFranceGabonGambia, TheGeorgiaGermanyGhanaGreeceGrenadaGuatemalaGuineaGuinea-BissauGuyanaHaitiHeavily indebted poor countries (HIPC)High incomeHondurasHong Kong SAR, ChinaHungaryIBRD onlyIcelandIDA & IBRD totalIDA blendIDA onlyIDA totalIndiaIndonesiaIran, Islamic Rep.IraqIrelandIsraelItalyJamaicaJapanJordanKazakhstanKenyaKorea, Dem. People’s Rep.Korea, Rep.KuwaitKyrgyz RepublicLao PDRLate-demographic dividendLatin America & Caribbean Latin America & Caribbean (excluding high income)Latin America & the Caribbean (IDA & IBRD countries)LatviaLeast developed countries: UN classificationLebanonLesothoLiberiaLibyaLiechtensteinLithuaniaLow & middle incomeLow incomeLower middle incomeLuxembourgMacao SAR, ChinaMacedonia, FYRMadagascarMalawiMaldivesMaliMaltaMarshall IslandsMauritaniaMauritiusMexicoMicronesia, Fed. Sts.Middle East & North AfricaMiddle East & North Africa (excluding high income)Middle East & North Africa (IDA & IBRD countries)Middle incomeMoldovaMongoliaMontenegroMoroccoMozambiqueMyanmarNamibiaNepalNetherlandsNew ZealandNicaraguaNigerNigeriaNorth AmericaNorwayOECD membersOmanOther small statesPacific island small statesPakistanPalauPanamaPapua New GuineaParaguayPeruPhilippinesPolandPortugalPost-demographic dividendPre-demographic dividendPuerto RicoQatarRomaniaRussian FederationRwandaSamoaSan MarinoSao Tome and PrincipeSaudi ArabiaSenegalSerbiaSeychellesSierra LeoneSingaporeSlovak RepublicSloveniaSmall statesSomaliaSouth AfricaSouth AsiaSouth Asia (IDA & IBRD)SpainSri LankaSt. Kitts and NevisSt. LuciaSt. Vincent and the GrenadinesSub-Saharan Africa Sub-Saharan Africa (excluding high income)Sub-Saharan Africa (IDA & IBRD countries)SudanSurinameSwazilandSwedenSwitzerlandSyrian Arab RepublicTajikistanTanzaniaThailandTimor-LesteTogoTongaTrinidad and TobagoTunisiaTurkeyTurkmenistanUgandaUkraineUnited Arab EmiratesUnited KingdomUnited StatesUpper middle incomeUruguayUzbekistanVanuatuVenezuela, RBVietnamWest Bank and GazaWorldYemen, Rep.ZambiaZimbabwe Timeline:
This timeline shows a graph from 1971 to 2015 of Low & middle income. No data until 1970. Number of actual observations by date: 45.
Source name:
World Development Indicators
Source organization:
United Nations Educational, Scientific, and Cultural Organization (UNESCO) Institute for Statistics.
Categories, topics:
Education, Gender
Last updated:
apr 23, 2017
Indicators value changes by year
At the date of observation
Value
Absolute change
Change from previous value
jan 1, 1971
5.251
+5.251
0.0%
jan 1, 1972
5.265
+0.014
0.27%
jan 1, 1973
5.343
+0.078
1.48%
jan 1, 1974
5.435
+0.092
1.73%
jan 1, 1975
5.646
+0.211
3.88%
jan 1, 1976
5.886
+0.239
4.24%
jan 1, 1977
6.031
+0.145
2.47%
jan 1, 1978
6.179
+0.148
2.45%
jan 1, 1979
6.35
+0.172
2.78%
jan 1, 1980
6.552
+0.202
3.18%
jan 1, 1981
6.663
+0.11
1.69%
jan 1, 1982
6.825
+0.163
2.44%
jan 1, 1983
7.007
+0.182
2.66%
jan 1, 1984
7.144
+0.137
1.96%
jan 1, 1985
7.514
+0.37
5.17%
jan 1, 1986
7.634
+0.12
1.59%
jan 1, 1987
7.466
-0.167
-2.19%
jan 1, 1988
7.509
+0.042
0.57%
jan 1, 1989
7.396
-0.113
-1.5%
jan 1, 1990
7.453
+0.057
0.77%
jan 1, 1991
7.516
+0.064
0.86%
jan 1, 1992
7.609
+0.092
1.23%
jan 1, 1993
7.639
+0.03
0.39%
jan 1, 1994
7.736
+0.097
1.27%
jan 1, 1995
8.047
+0.311
4.02%
jan 1, 1996
8.609
+0.562
6.98%
jan 1, 1997
9.05
+0.441
5.12%
jan 1, 1998
9.904
+0.854
9.43%
jan 1, 1999
10.607
+0.703
7.1%
jan 1, 2000
11.673
+1.066
10.05%
jan 1, 2001
12.573
+0.9
7.71%
jan 1, 2002
13.61
+1.037
8.25%
jan 1, 2003
14.97
+1.36
9.99%
jan 1, 2004
16.085
+1.115
7.45%
jan 1, 2005
17.059
+0.974
6.06%
jan 1, 2006
17.97
+0.911
5.34%
jan 1, 2007
19.098
+1.128
6.28%
jan 1, 2008
20.19
+1.092
5.72%
jan 1, 2009
21.404
+1.214
6.01%
jan 1, 2010
22.434
+1.03
4.81%
jan 1, 2011
23.644
+1.21
5.39%
jan 1, 2012
25.332
+1.687
7.14%
jan 1, 2013
26.954
+1.622
6.4%
jan 1, 2014
27.987
+1.033
3.83%
jan 1, 2015
30.01
+2.024
7.23%
Ranking of countries by current statistics by years


Comments: