29
/
en
AIzaSyAYiBZKx7MnpbEhh9jyipgxe19OcubqV5w
April 1, 2024
133613
Finland
FIN
true
2
1
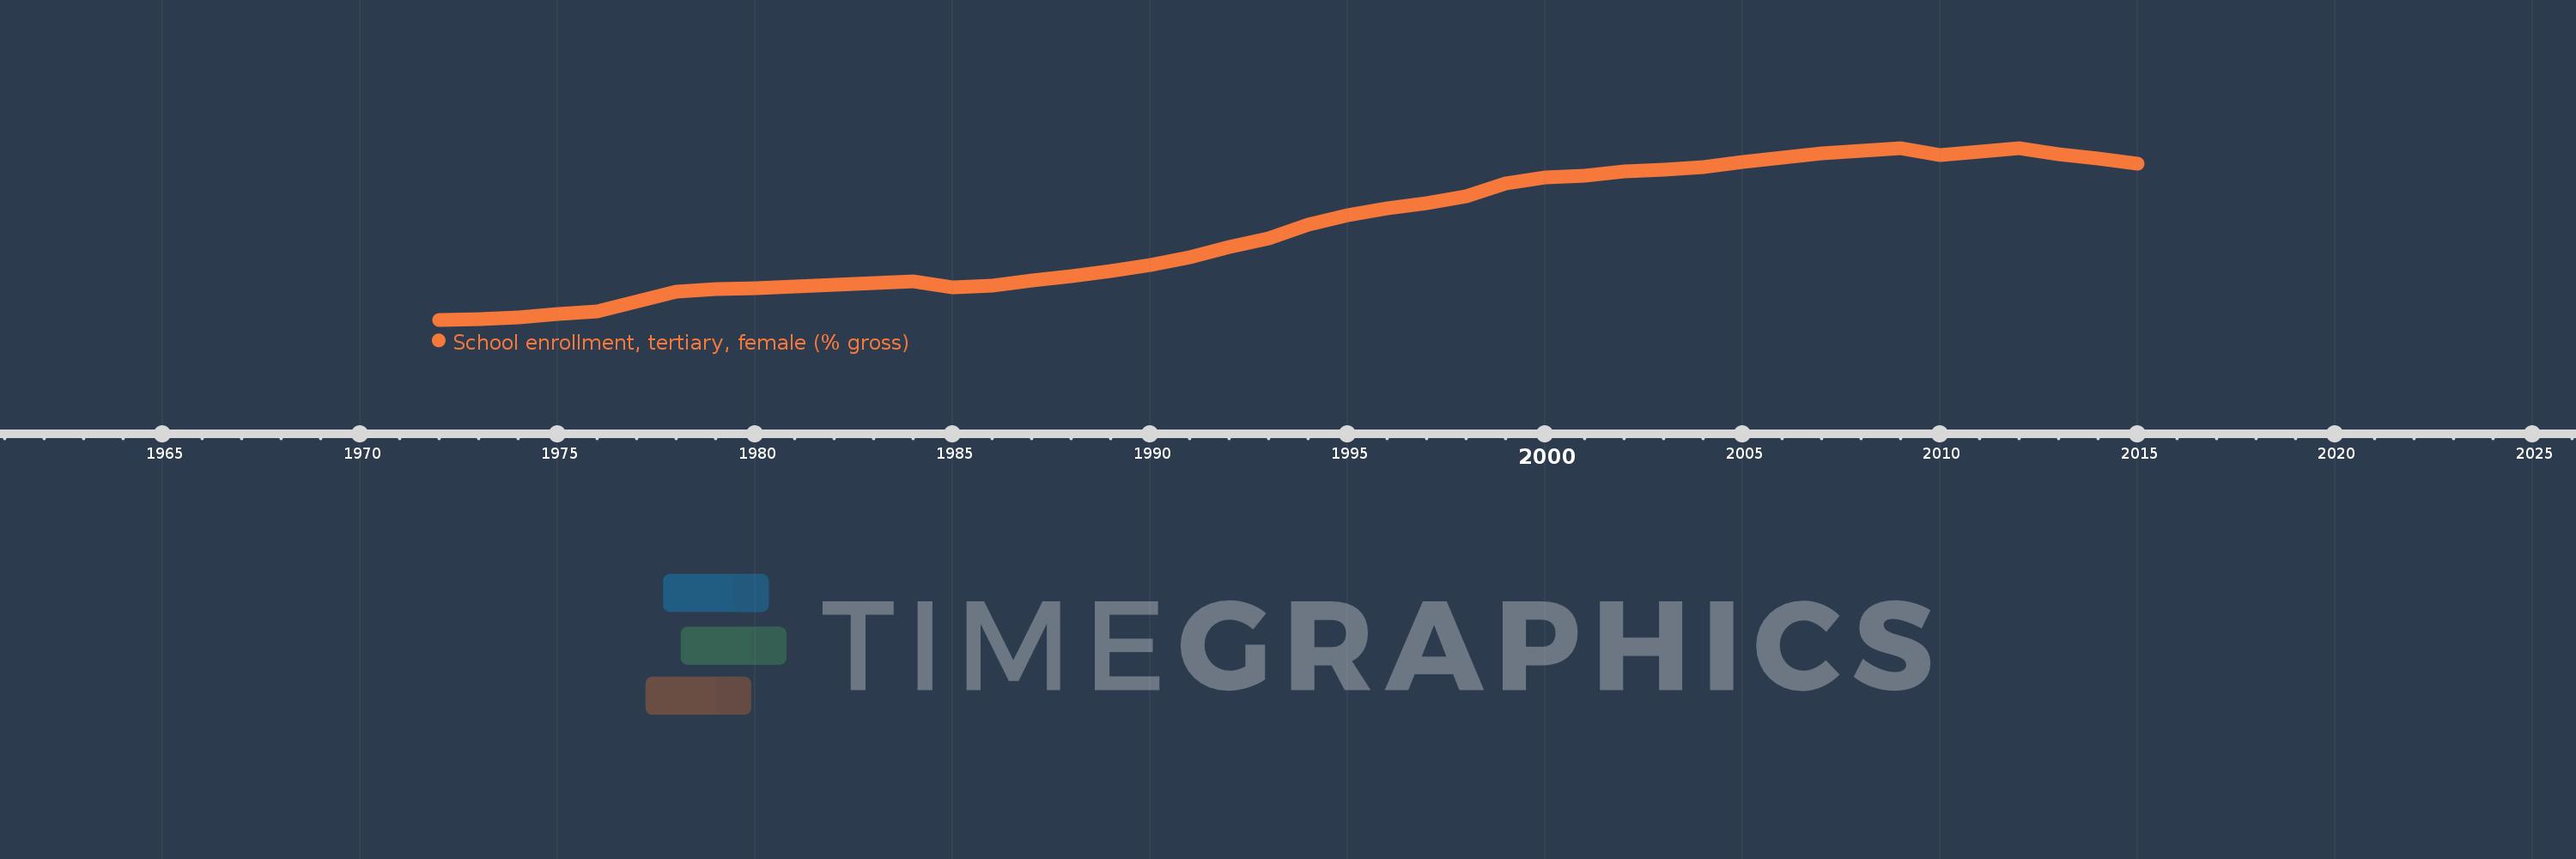
School enrollment, tertiary, female (% gross)
2015,2014,2013,2012,2011,2010,2009,2008,2007,2006,2005,2004,2003,2002,2001,2000,1999,1998,1997,1996,1995,1994,1993,1992,1991,1990,1989,1988,1987,1986,1985,1984,1983,1982,1981,1980,1979,1978,1976,1975,1974,1973,1972
This statistics in other country:
AfghanistanAlbaniaAlgeriaAngolaAntigua and BarbudaArab WorldArgentinaArmeniaArubaAustraliaAustriaAzerbaijanBahamas, TheBahrainBangladeshBarbadosBelarusBelgiumBelizeBeninBermudaBhutanBoliviaBosnia and HerzegovinaBotswanaBrazilBrunei DarussalamBulgariaBurkina FasoBurundiCabo VerdeCambodiaCameroonCanadaCaribbean small statesCentral African RepublicCentral Europe and the BalticsChadChileChinaColombiaComorosCongo, Dem. Rep.Congo, Rep.Costa RicaCote d'IvoireCroatiaCubaCuracaoCyprusCzech RepublicDenmarkDjiboutiDominicaDominican RepublicEarly-demographic dividendEast Asia & PacificEast Asia & Pacific (excluding high income)East Asia & Pacific (IDA & IBRD countries)EcuadorEgypt, Arab Rep.El SalvadorEquatorial GuineaEritreaEstoniaEthiopiaEuro areaEurope & Central AsiaEurope & Central Asia (excluding high income)Europe & Central Asia (IDA & IBRD countries)European UnionFijiFinlandFragile and conflict affected situationsFranceGabonGambia, TheGeorgiaGermanyGhanaGreeceGrenadaGuatemalaGuineaGuinea-BissauGuyanaHaitiHeavily indebted poor countries (HIPC)High incomeHondurasHong Kong SAR, ChinaHungaryIBRD onlyIcelandIDA & IBRD totalIDA blendIDA onlyIDA totalIndiaIndonesiaIran, Islamic Rep.IraqIrelandIsraelItalyJamaicaJapanJordanKazakhstanKenyaKorea, Dem. People’s Rep.Korea, Rep.KuwaitKyrgyz RepublicLao PDRLate-demographic dividendLatin America & Caribbean Latin America & Caribbean (excluding high income)Latin America & the Caribbean (IDA & IBRD countries)LatviaLeast developed countries: UN classificationLebanonLesothoLiberiaLibyaLiechtensteinLithuaniaLow & middle incomeLow incomeLower middle incomeLuxembourgMacao SAR, ChinaMacedonia, FYRMadagascarMalawiMaldivesMaliMaltaMarshall IslandsMauritaniaMauritiusMexicoMicronesia, Fed. Sts.Middle East & North AfricaMiddle East & North Africa (excluding high income)Middle East & North Africa (IDA & IBRD countries)Middle incomeMoldovaMongoliaMontenegroMoroccoMozambiqueMyanmarNamibiaNepalNetherlandsNew ZealandNicaraguaNigerNigeriaNorth AmericaNorwayOECD membersOmanOther small statesPacific island small statesPakistanPalauPanamaPapua New GuineaParaguayPeruPhilippinesPolandPortugalPost-demographic dividendPre-demographic dividendPuerto RicoQatarRomaniaRussian FederationRwandaSamoaSan MarinoSao Tome and PrincipeSaudi ArabiaSenegalSerbiaSeychellesSierra LeoneSingaporeSlovak RepublicSloveniaSmall statesSomaliaSouth AfricaSouth AsiaSouth Asia (IDA & IBRD)SpainSri LankaSt. Kitts and NevisSt. LuciaSt. Vincent and the GrenadinesSub-Saharan Africa Sub-Saharan Africa (excluding high income)Sub-Saharan Africa (IDA & IBRD countries)SudanSurinameSwazilandSwedenSwitzerlandSyrian Arab RepublicTajikistanTanzaniaThailandTimor-LesteTogoTongaTrinidad and TobagoTunisiaTurkeyTurkmenistanUgandaUkraineUnited Arab EmiratesUnited KingdomUnited StatesUpper middle incomeUruguayUzbekistanVanuatuVenezuela, RBVietnamWest Bank and GazaWorldYemen, Rep.ZambiaZimbabwe Timeline:
This timeline shows a graph from 1972 to 2015 of Finland. No data until 1971. Number of actual observations by date: 43.
Source name:
World Development Indicators
Source organization:
United Nations Educational, Scientific, and Cultural Organization (UNESCO) Institute for Statistics.
Categories, topics:
Education, Gender
Last updated:
apr 23, 2017
Indicators value changes by year
Minimum:
13.069
jan 1, 1972
Maximum:
105.653
jan 1, 2012
At the date of observation
Value
Absolute change
Change from previous value
jan 1, 1972
13.069
+13.069
0.0%
jan 1, 1973
13.52
+0.451
3.45%
jan 1, 1974
14.204
+0.684
5.06%
jan 1, 1975
15.996
+1.792
12.62%
jan 1, 1976
17.403
+1.406
8.79%
jan 1, 1978
28.359
+10.956
62.96%
jan 1, 1979
29.666
+1.307
4.61%
jan 1, 1980
30.261
+0.594
2.0%
jan 1, 1981
30.893
+0.632
2.09%
jan 1, 1982
31.76
+0.867
2.81%
jan 1, 1983
32.634
+0.873
2.75%
jan 1, 1984
33.649
+1.015
3.11%
jan 1, 1985
30.738
-2.911
-8.65%
jan 1, 1986
31.555
+0.817
2.66%
jan 1, 1987
34.037
+2.482
7.87%
jan 1, 1988
36.663
+2.626
7.72%
jan 1, 1989
39.214
+2.551
6.96%
jan 1, 1990
42.733
+3.519
8.97%
jan 1, 1991
46.822
+4.089
9.57%
jan 1, 1992
52.053
+5.231
11.17%
jan 1, 1993
57.007
+4.954
9.52%
jan 1, 1994
64.388
+7.381
12.95%
jan 1, 1995
69.515
+5.127
7.96%
jan 1, 1996
73.039
+3.523
5.07%
jan 1, 1997
75.915
+2.876
3.94%
jan 1, 1998
79.434
+3.519
4.64%
jan 1, 1999
86.749
+7.315
9.21%
jan 1, 2000
89.899
+3.15
3.63%
jan 1, 2001
90.486
+0.587
0.65%
jan 1, 2002
92.935
+2.449
2.71%
jan 1, 2003
93.976
+1.041
1.12%
jan 1, 2004
95.282
+1.306
1.39%
jan 1, 2005
97.949
+2.667
2.8%
jan 1, 2006
100.635
+2.686
2.74%
jan 1, 2007
102.874
+2.239
2.22%
jan 1, 2008
103.963
+1.089
1.06%
jan 1, 2009
105.607
+1.644
1.58%
jan 1, 2010
101.594
-4.013
-3.8%
jan 1, 2011
103.712
+2.118
2.08%
jan 1, 2012
105.653
+1.941
1.87%
jan 1, 2013
102.332
-3.321
-3.14%
jan 1, 2014
99.885
-2.447
-2.39%
jan 1, 2015
97.194
-2.691
-2.69%
Ranking of countries by current statistics by years


Comments: