29
/
en
AIzaSyAYiBZKx7MnpbEhh9jyipgxe19OcubqV5w
April 1, 2024
28691
East Asia & Pacific (excluding high income)
EAP
false
2
1
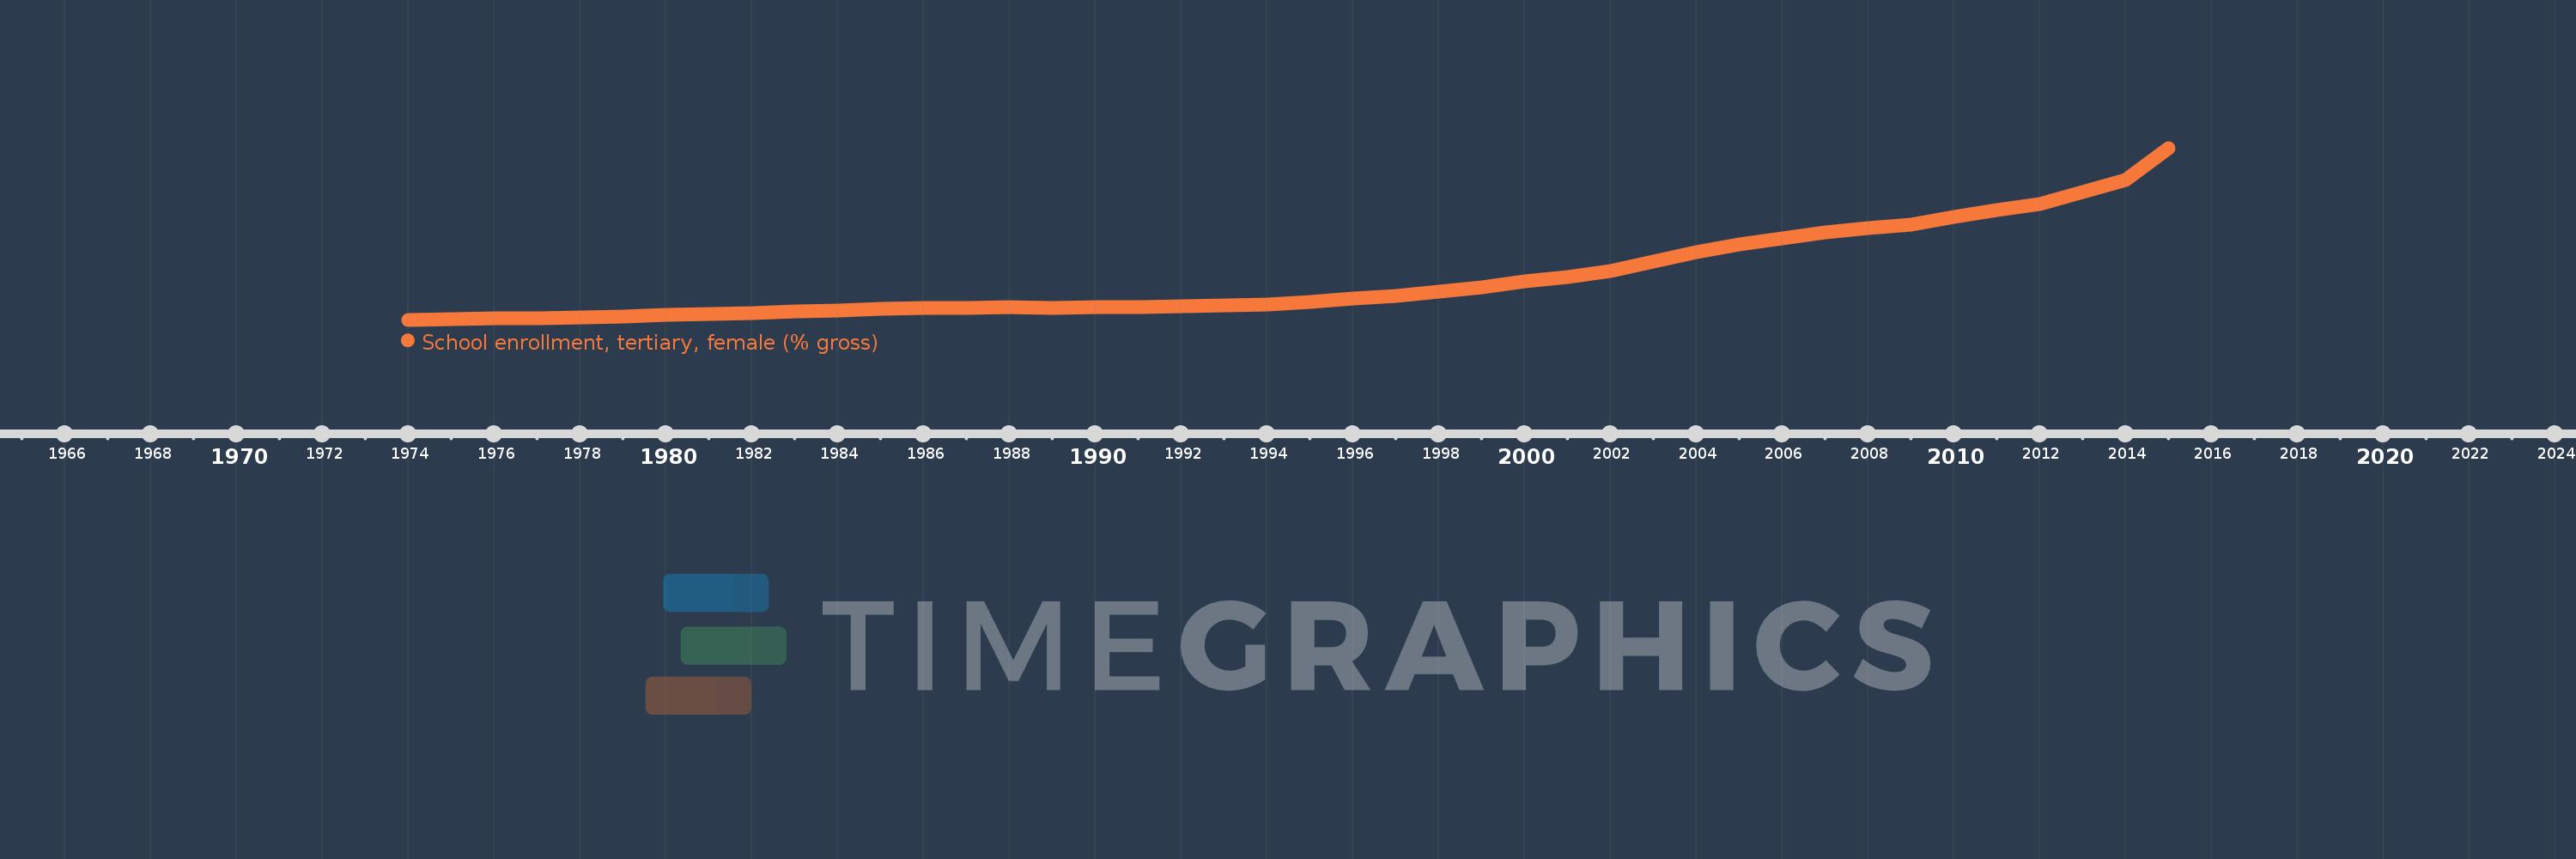
School enrollment, tertiary, female (% gross)
2015,2014,2013,2012,2011,2010,2009,2008,2007,2006,2005,2004,2003,2002,2001,2000,1999,1998,1997,1996,1995,1994,1993,1992,1991,1990,1989,1988,1987,1986,1985,1984,1983,1982,1981,1980,1979,1978,1977,1976,1975,1974
This statistics in other country:
AfghanistanAlbaniaAlgeriaAngolaAntigua and BarbudaArab WorldArgentinaArmeniaArubaAustraliaAustriaAzerbaijanBahamas, TheBahrainBangladeshBarbadosBelarusBelgiumBelizeBeninBermudaBhutanBoliviaBosnia and HerzegovinaBotswanaBrazilBrunei DarussalamBulgariaBurkina FasoBurundiCabo VerdeCambodiaCameroonCanadaCaribbean small statesCentral African RepublicCentral Europe and the BalticsChadChileChinaColombiaComorosCongo, Dem. Rep.Congo, Rep.Costa RicaCote d'IvoireCroatiaCubaCuracaoCyprusCzech RepublicDenmarkDjiboutiDominicaDominican RepublicEarly-demographic dividendEast Asia & PacificEast Asia & Pacific (excluding high income)East Asia & Pacific (IDA & IBRD countries)EcuadorEgypt, Arab Rep.El SalvadorEquatorial GuineaEritreaEstoniaEthiopiaEuro areaEurope & Central AsiaEurope & Central Asia (excluding high income)Europe & Central Asia (IDA & IBRD countries)European UnionFijiFinlandFragile and conflict affected situationsFranceGabonGambia, TheGeorgiaGermanyGhanaGreeceGrenadaGuatemalaGuineaGuinea-BissauGuyanaHaitiHeavily indebted poor countries (HIPC)High incomeHondurasHong Kong SAR, ChinaHungaryIBRD onlyIcelandIDA & IBRD totalIDA blendIDA onlyIDA totalIndiaIndonesiaIran, Islamic Rep.IraqIrelandIsraelItalyJamaicaJapanJordanKazakhstanKenyaKorea, Dem. People’s Rep.Korea, Rep.KuwaitKyrgyz RepublicLao PDRLate-demographic dividendLatin America & Caribbean Latin America & Caribbean (excluding high income)Latin America & the Caribbean (IDA & IBRD countries)LatviaLeast developed countries: UN classificationLebanonLesothoLiberiaLibyaLiechtensteinLithuaniaLow & middle incomeLow incomeLower middle incomeLuxembourgMacao SAR, ChinaMacedonia, FYRMadagascarMalawiMaldivesMaliMaltaMarshall IslandsMauritaniaMauritiusMexicoMicronesia, Fed. Sts.Middle East & North AfricaMiddle East & North Africa (excluding high income)Middle East & North Africa (IDA & IBRD countries)Middle incomeMoldovaMongoliaMontenegroMoroccoMozambiqueMyanmarNamibiaNepalNetherlandsNew ZealandNicaraguaNigerNigeriaNorth AmericaNorwayOECD membersOmanOther small statesPacific island small statesPakistanPalauPanamaPapua New GuineaParaguayPeruPhilippinesPolandPortugalPost-demographic dividendPre-demographic dividendPuerto RicoQatarRomaniaRussian FederationRwandaSamoaSan MarinoSao Tome and PrincipeSaudi ArabiaSenegalSerbiaSeychellesSierra LeoneSingaporeSlovak RepublicSloveniaSmall statesSomaliaSouth AfricaSouth AsiaSouth Asia (IDA & IBRD)SpainSri LankaSt. Kitts and NevisSt. LuciaSt. Vincent and the GrenadinesSub-Saharan Africa Sub-Saharan Africa (excluding high income)Sub-Saharan Africa (IDA & IBRD countries)SudanSurinameSwazilandSwedenSwitzerlandSyrian Arab RepublicTajikistanTanzaniaThailandTimor-LesteTogoTongaTrinidad and TobagoTunisiaTurkeyTurkmenistanUgandaUkraineUnited Arab EmiratesUnited KingdomUnited StatesUpper middle incomeUruguayUzbekistanVanuatuVenezuela, RBVietnamWest Bank and GazaWorldYemen, Rep.ZambiaZimbabwe Timeline:
This timeline shows a graph from 1974 to 2015 of East Asia & Pacific (excluding high income). No data until 1973. Number of actual observations by date: 42.
Source name:
World Development Indicators
Source organization:
United Nations Educational, Scientific, and Cultural Organization (UNESCO) Institute for Statistics.
Categories, topics:
Education, Gender
Last updated:
apr 23, 2017
Indicators value changes by year
Maximum:
39.134
jan 1, 2015
At the date of observation
Value
Absolute change
Change from previous value
jan 1, 1974
1.294
+1.294
0.0%
jan 1, 1975
1.425
+0.131
10.16%
jan 1, 1976
1.576
+0.151
10.58%
jan 1, 1977
1.702
+0.126
8.0%
jan 1, 1978
1.85
+0.148
8.68%
jan 1, 1979
2.035
+0.185
10.0%
jan 1, 1980
2.331
+0.296
14.56%
jan 1, 1981
2.541
+0.209
8.99%
jan 1, 1982
2.781
+0.241
9.48%
jan 1, 1983
3.207
+0.426
15.3%
jan 1, 1984
3.385
+0.178
5.56%
jan 1, 1985
3.635
+0.25
7.37%
jan 1, 1986
3.797
+0.162
4.46%
jan 1, 1987
3.887
+0.09
2.38%
jan 1, 1988
4.002
+0.115
2.95%
jan 1, 1989
3.954
-0.048
-1.19%
jan 1, 1990
4.116
+0.162
4.1%
jan 1, 1991
4.167
+0.051
1.23%
jan 1, 1992
4.357
+0.19
4.55%
jan 1, 1993
4.467
+0.11
2.52%
jan 1, 1994
4.713
+0.246
5.51%
jan 1, 1995
5.294
+0.581
12.33%
jan 1, 1996
5.965
+0.671
12.67%
jan 1, 1997
6.559
+0.594
9.97%
jan 1, 1998
7.502
+0.942
14.36%
jan 1, 1999
8.448
+0.946
12.61%
jan 1, 2000
9.66
+1.212
14.35%
jan 1, 2001
10.71
+1.05
10.87%
jan 1, 2002
12.029
+1.319
12.31%
jan 1, 2003
14.179
+2.15
17.88%
jan 1, 2004
16.11
+1.931
13.62%
jan 1, 2005
17.966
+1.856
11.52%
jan 1, 2006
19.165
+1.2
6.68%
jan 1, 2007
20.45
+1.284
6.7%
jan 1, 2008
21.491
+1.041
5.09%
jan 1, 2009
22.216
+0.726
3.38%
jan 1, 2010
23.942
+1.726
7.77%
jan 1, 2011
25.528
+1.587
6.63%
jan 1, 2012
26.869
+1.34
5.25%
jan 1, 2013
29.436
+2.567
9.55%
jan 1, 2014
32.12
+2.685
9.12%
jan 1, 2015
39.134
+7.014
21.84%
Ranking of countries by current statistics by years


Comments: