29
/
en
AIzaSyAYiBZKx7MnpbEhh9jyipgxe19OcubqV5w
April 1, 2024
26118
Central Europe and the Baltics
CEB
false
2
1
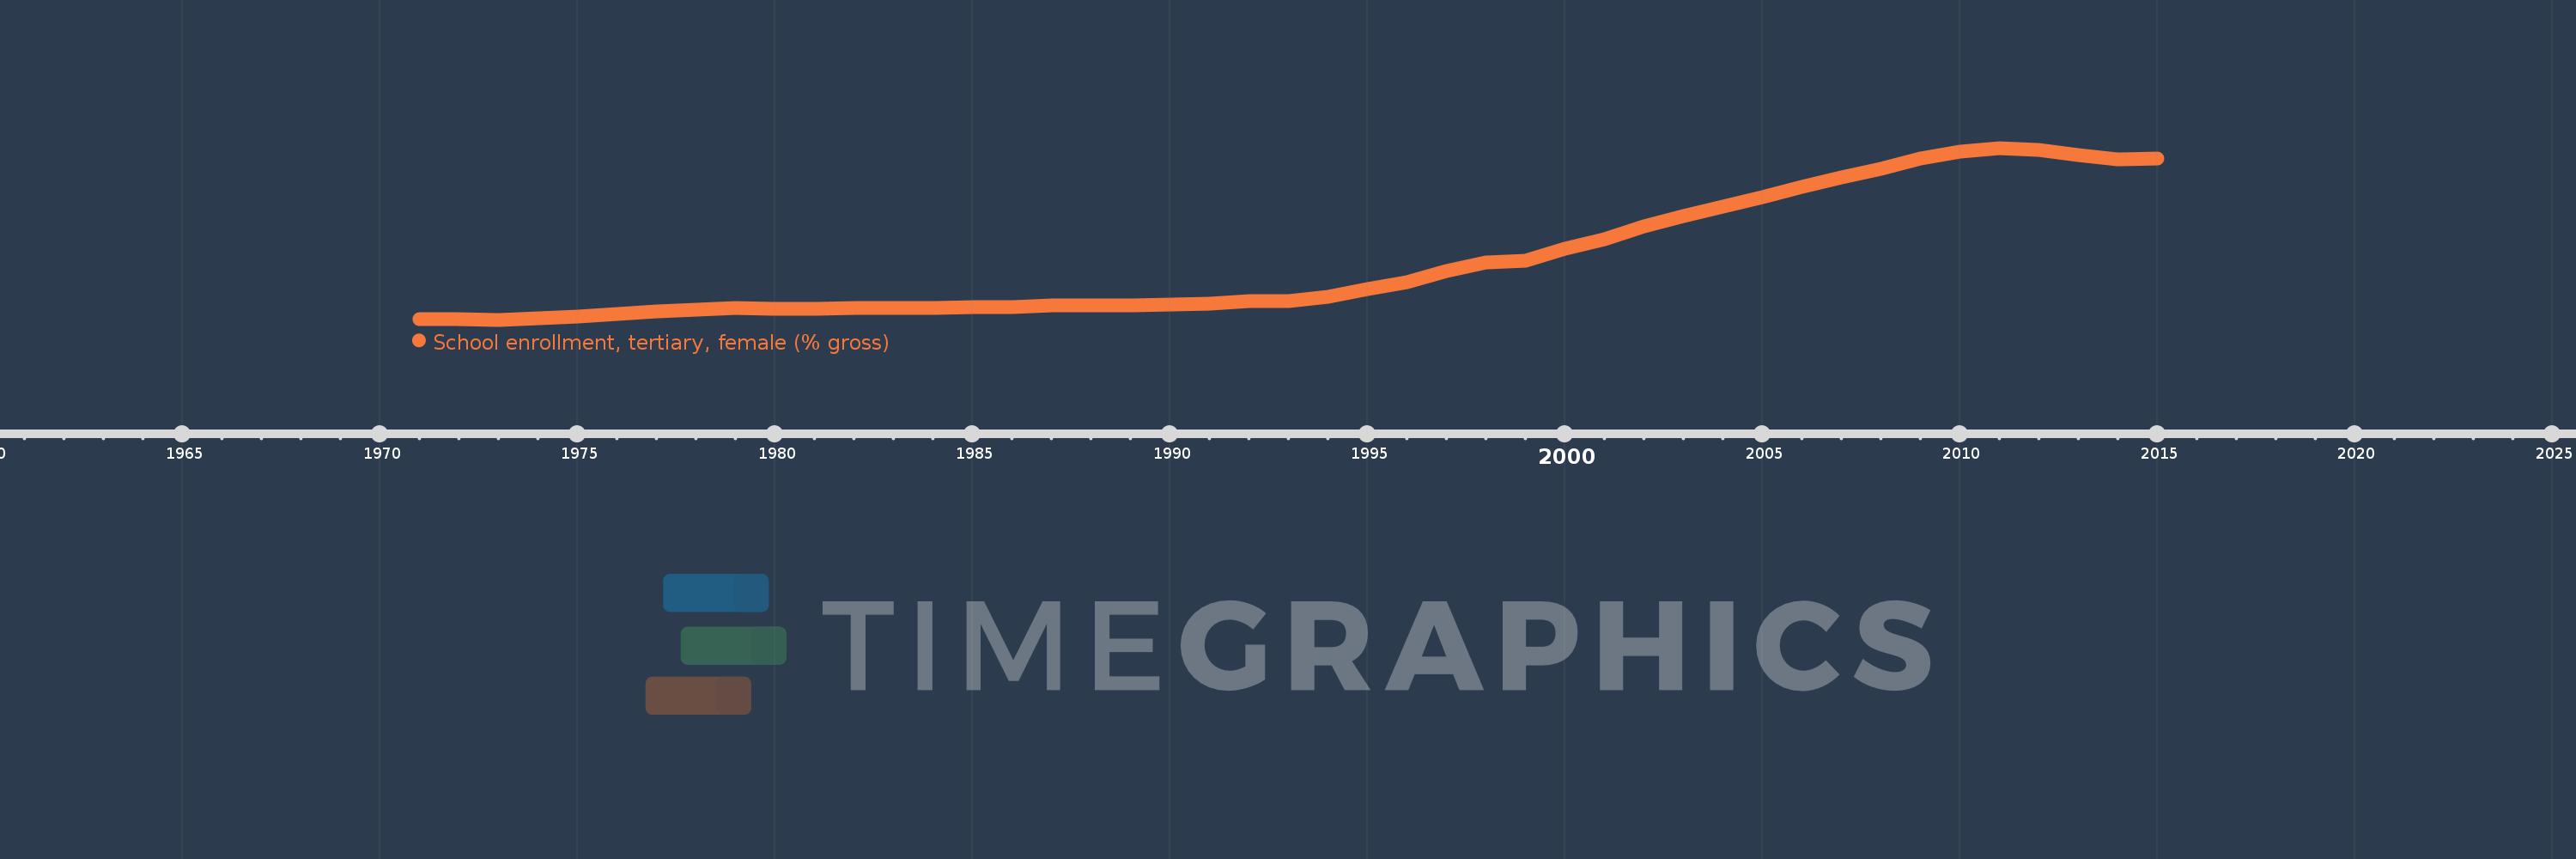
School enrollment, tertiary, female (% gross)
2015,2014,2013,2012,2011,2010,2009,2008,2007,2006,2005,2004,2003,2002,2001,2000,1999,1998,1997,1996,1995,1994,1993,1992,1991,1990,1989,1988,1987,1986,1985,1984,1983,1982,1981,1980,1979,1978,1977,1976,1975,1974,1973,1972,1971
This statistics in other country:
AfghanistanAlbaniaAlgeriaAngolaAntigua and BarbudaArab WorldArgentinaArmeniaArubaAustraliaAustriaAzerbaijanBahamas, TheBahrainBangladeshBarbadosBelarusBelgiumBelizeBeninBermudaBhutanBoliviaBosnia and HerzegovinaBotswanaBrazilBrunei DarussalamBulgariaBurkina FasoBurundiCabo VerdeCambodiaCameroonCanadaCaribbean small statesCentral African RepublicCentral Europe and the BalticsChadChileChinaColombiaComorosCongo, Dem. Rep.Congo, Rep.Costa RicaCote d'IvoireCroatiaCubaCuracaoCyprusCzech RepublicDenmarkDjiboutiDominicaDominican RepublicEarly-demographic dividendEast Asia & PacificEast Asia & Pacific (excluding high income)East Asia & Pacific (IDA & IBRD countries)EcuadorEgypt, Arab Rep.El SalvadorEquatorial GuineaEritreaEstoniaEthiopiaEuro areaEurope & Central AsiaEurope & Central Asia (excluding high income)Europe & Central Asia (IDA & IBRD countries)European UnionFijiFinlandFragile and conflict affected situationsFranceGabonGambia, TheGeorgiaGermanyGhanaGreeceGrenadaGuatemalaGuineaGuinea-BissauGuyanaHaitiHeavily indebted poor countries (HIPC)High incomeHondurasHong Kong SAR, ChinaHungaryIBRD onlyIcelandIDA & IBRD totalIDA blendIDA onlyIDA totalIndiaIndonesiaIran, Islamic Rep.IraqIrelandIsraelItalyJamaicaJapanJordanKazakhstanKenyaKorea, Dem. People’s Rep.Korea, Rep.KuwaitKyrgyz RepublicLao PDRLate-demographic dividendLatin America & Caribbean Latin America & Caribbean (excluding high income)Latin America & the Caribbean (IDA & IBRD countries)LatviaLeast developed countries: UN classificationLebanonLesothoLiberiaLibyaLiechtensteinLithuaniaLow & middle incomeLow incomeLower middle incomeLuxembourgMacao SAR, ChinaMacedonia, FYRMadagascarMalawiMaldivesMaliMaltaMarshall IslandsMauritaniaMauritiusMexicoMicronesia, Fed. Sts.Middle East & North AfricaMiddle East & North Africa (excluding high income)Middle East & North Africa (IDA & IBRD countries)Middle incomeMoldovaMongoliaMontenegroMoroccoMozambiqueMyanmarNamibiaNepalNetherlandsNew ZealandNicaraguaNigerNigeriaNorth AmericaNorwayOECD membersOmanOther small statesPacific island small statesPakistanPalauPanamaPapua New GuineaParaguayPeruPhilippinesPolandPortugalPost-demographic dividendPre-demographic dividendPuerto RicoQatarRomaniaRussian FederationRwandaSamoaSan MarinoSao Tome and PrincipeSaudi ArabiaSenegalSerbiaSeychellesSierra LeoneSingaporeSlovak RepublicSloveniaSmall statesSomaliaSouth AfricaSouth AsiaSouth Asia (IDA & IBRD)SpainSri LankaSt. Kitts and NevisSt. LuciaSt. Vincent and the GrenadinesSub-Saharan Africa Sub-Saharan Africa (excluding high income)Sub-Saharan Africa (IDA & IBRD countries)SudanSurinameSwazilandSwedenSwitzerlandSyrian Arab RepublicTajikistanTanzaniaThailandTimor-LesteTogoTongaTrinidad and TobagoTunisiaTurkeyTurkmenistanUgandaUkraineUnited Arab EmiratesUnited KingdomUnited StatesUpper middle incomeUruguayUzbekistanVanuatuVenezuela, RBVietnamWest Bank and GazaWorldYemen, Rep.ZambiaZimbabwe Timeline:
This timeline shows a graph from 1971 to 2015 of Central Europe and the Baltics. No data until 1970. Number of actual observations by date: 45.
Source name:
World Development Indicators
Source organization:
United Nations Educational, Scientific, and Cultural Organization (UNESCO) Institute for Statistics.
Categories, topics:
Education, Gender
Last updated:
apr 23, 2017
Indicators value changes by year
Minimum:
12.129
jan 1, 1973
Maximum:
81.077
jan 1, 2011
At the date of observation
Value
Absolute change
Change from previous value
jan 1, 1971
12.27
+12.27
0.0%
jan 1, 1972
12.267
-0.003
-0.03%
jan 1, 1973
12.129
-0.138
-1.13%
jan 1, 1974
12.562
+0.433
3.57%
jan 1, 1975
13.485
+0.923
7.35%
jan 1, 1976
14.307
+0.822
6.1%
jan 1, 1977
15.314
+1.007
7.04%
jan 1, 1978
16.171
+0.857
5.59%
jan 1, 1979
16.779
+0.608
3.76%
jan 1, 1980
16.606
-0.173
-1.03%
jan 1, 1981
16.674
+0.069
0.41%
jan 1, 1982
16.787
+0.112
0.67%
jan 1, 1983
16.844
+0.058
0.34%
jan 1, 1984
16.686
-0.159
-0.94%
jan 1, 1985
17.108
+0.422
2.53%
jan 1, 1986
17.338
+0.229
1.34%
jan 1, 1987
17.803
+0.465
2.68%
jan 1, 1988
17.9
+0.097
0.54%
jan 1, 1989
17.885
-0.015
-0.08%
jan 1, 1990
18.257
+0.372
2.08%
jan 1, 1991
18.612
+0.355
1.94%
jan 1, 1992
19.446
+0.835
4.49%
jan 1, 1993
19.683
+0.236
1.22%
jan 1, 1994
21.256
+1.573
7.99%
jan 1, 1995
24.469
+3.213
15.12%
jan 1, 1996
27.254
+2.784
11.38%
jan 1, 1997
31.781
+4.527
16.61%
jan 1, 1998
35.094
+3.313
10.43%
jan 1, 1999
35.863
+0.769
2.19%
jan 1, 2000
40.501
+4.638
12.93%
jan 1, 2001
44.586
+4.085
10.09%
jan 1, 2002
49.667
+5.081
11.4%
jan 1, 2003
53.758
+4.09
8.24%
jan 1, 2004
57.594
+3.837
7.14%
jan 1, 2005
61.436
+3.842
6.67%
jan 1, 2006
65.631
+4.195
6.83%
jan 1, 2007
69.142
+3.511
5.35%
jan 1, 2008
72.677
+3.535
5.11%
jan 1, 2009
76.999
+4.322
5.95%
jan 1, 2010
79.48
+2.48
3.22%
jan 1, 2011
81.077
+1.598
2.01%
jan 1, 2012
80.233
-0.844
-1.04%
jan 1, 2013
78.049
-2.185
-2.72%
jan 1, 2014
76.577
-1.471
-1.89%
jan 1, 2015
76.774
+0.197
0.26%
Ranking of countries by current statistics by years


Comments: