29
/
en
AIzaSyAYiBZKx7MnpbEhh9jyipgxe19OcubqV5w
April 1, 2024
42985
Latin America & Caribbean (excluding high income)
LAC
false
2
1
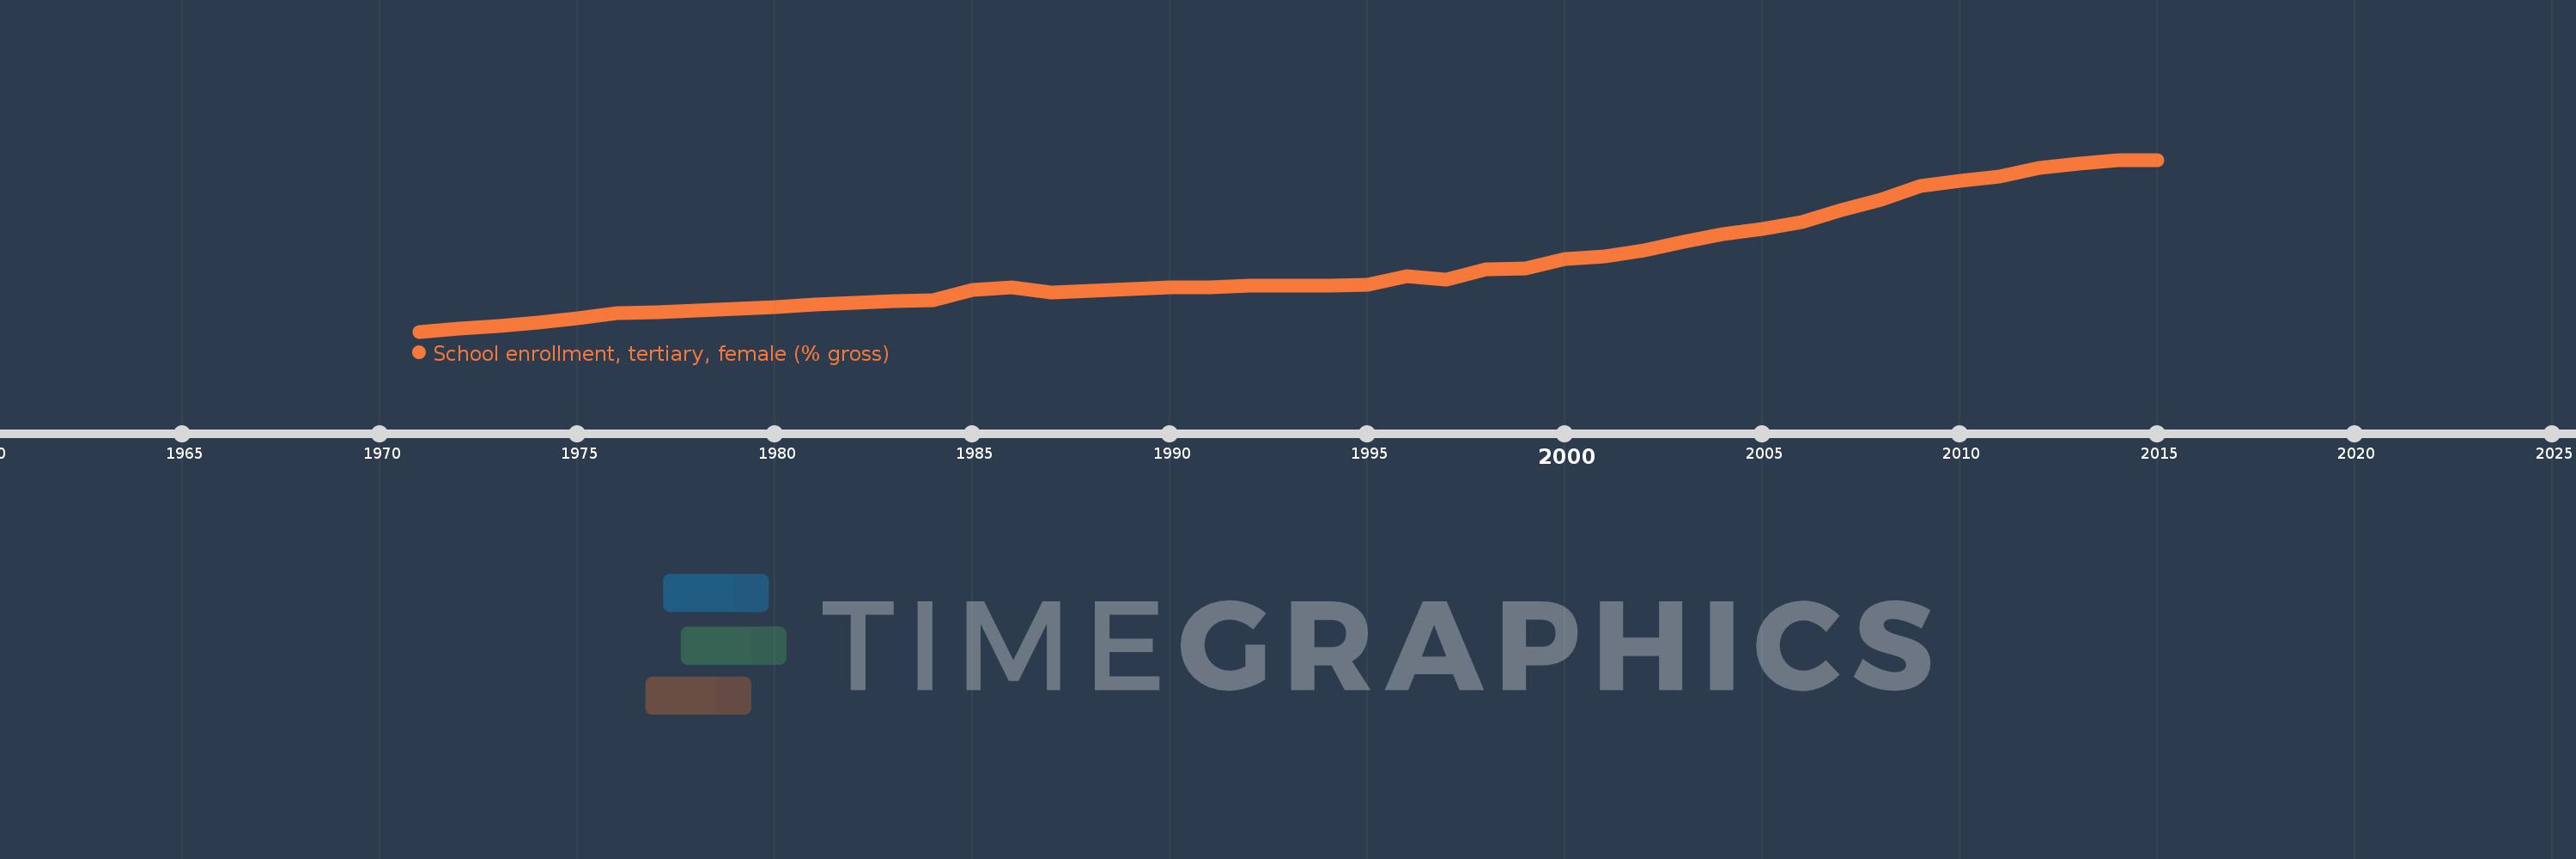
School enrollment, tertiary, female (% gross)
2015,2014,2013,2012,2011,2010,2009,2008,2007,2006,2005,2004,2003,2002,2001,2000,1999,1998,1997,1996,1995,1994,1993,1992,1991,1990,1989,1988,1987,1986,1985,1984,1983,1982,1981,1980,1979,1978,1977,1976,1975,1974,1973,1972,1971
This statistics in other country:
AfghanistanAlbaniaAlgeriaAngolaAntigua and BarbudaArab WorldArgentinaArmeniaArubaAustraliaAustriaAzerbaijanBahamas, TheBahrainBangladeshBarbadosBelarusBelgiumBelizeBeninBermudaBhutanBoliviaBosnia and HerzegovinaBotswanaBrazilBrunei DarussalamBulgariaBurkina FasoBurundiCabo VerdeCambodiaCameroonCanadaCaribbean small statesCentral African RepublicCentral Europe and the BalticsChadChileChinaColombiaComorosCongo, Dem. Rep.Congo, Rep.Costa RicaCote d'IvoireCroatiaCubaCuracaoCyprusCzech RepublicDenmarkDjiboutiDominicaDominican RepublicEarly-demographic dividendEast Asia & PacificEast Asia & Pacific (excluding high income)East Asia & Pacific (IDA & IBRD countries)EcuadorEgypt, Arab Rep.El SalvadorEquatorial GuineaEritreaEstoniaEthiopiaEuro areaEurope & Central AsiaEurope & Central Asia (excluding high income)Europe & Central Asia (IDA & IBRD countries)European UnionFijiFinlandFragile and conflict affected situationsFranceGabonGambia, TheGeorgiaGermanyGhanaGreeceGrenadaGuatemalaGuineaGuinea-BissauGuyanaHaitiHeavily indebted poor countries (HIPC)High incomeHondurasHong Kong SAR, ChinaHungaryIBRD onlyIcelandIDA & IBRD totalIDA blendIDA onlyIDA totalIndiaIndonesiaIran, Islamic Rep.IraqIrelandIsraelItalyJamaicaJapanJordanKazakhstanKenyaKorea, Dem. People’s Rep.Korea, Rep.KuwaitKyrgyz RepublicLao PDRLate-demographic dividendLatin America & Caribbean Latin America & Caribbean (excluding high income)Latin America & the Caribbean (IDA & IBRD countries)LatviaLeast developed countries: UN classificationLebanonLesothoLiberiaLibyaLiechtensteinLithuaniaLow & middle incomeLow incomeLower middle incomeLuxembourgMacao SAR, ChinaMacedonia, FYRMadagascarMalawiMaldivesMaliMaltaMarshall IslandsMauritaniaMauritiusMexicoMicronesia, Fed. Sts.Middle East & North AfricaMiddle East & North Africa (excluding high income)Middle East & North Africa (IDA & IBRD countries)Middle incomeMoldovaMongoliaMontenegroMoroccoMozambiqueMyanmarNamibiaNepalNetherlandsNew ZealandNicaraguaNigerNigeriaNorth AmericaNorwayOECD membersOmanOther small statesPacific island small statesPakistanPalauPanamaPapua New GuineaParaguayPeruPhilippinesPolandPortugalPost-demographic dividendPre-demographic dividendPuerto RicoQatarRomaniaRussian FederationRwandaSamoaSan MarinoSao Tome and PrincipeSaudi ArabiaSenegalSerbiaSeychellesSierra LeoneSingaporeSlovak RepublicSloveniaSmall statesSomaliaSouth AfricaSouth AsiaSouth Asia (IDA & IBRD)SpainSri LankaSt. Kitts and NevisSt. LuciaSt. Vincent and the GrenadinesSub-Saharan Africa Sub-Saharan Africa (excluding high income)Sub-Saharan Africa (IDA & IBRD countries)SudanSurinameSwazilandSwedenSwitzerlandSyrian Arab RepublicTajikistanTanzaniaThailandTimor-LesteTogoTongaTrinidad and TobagoTunisiaTurkeyTurkmenistanUgandaUkraineUnited Arab EmiratesUnited KingdomUnited StatesUpper middle incomeUruguayUzbekistanVanuatuVenezuela, RBVietnamWest Bank and GazaWorldYemen, Rep.ZambiaZimbabwe Timeline:
This timeline shows a graph from 1971 to 2015 of Latin America & Caribbean (excluding high income). No data until 1970. Number of actual observations by date: 45.
Source name:
World Development Indicators
Source organization:
United Nations Educational, Scientific, and Cultural Organization (UNESCO) Institute for Statistics.
Categories, topics:
Education, Gender
Last updated:
apr 23, 2017
Indicators value changes by year
Maximum:
48.967
jan 1, 2015
At the date of observation
Value
Absolute change
Change from previous value
jan 1, 1971
4.202
+4.202
0.0%
jan 1, 1972
4.903
+0.701
16.68%
jan 1, 1973
5.762
+0.859
17.53%
jan 1, 1974
6.544
+0.782
13.57%
jan 1, 1975
7.711
+1.167
17.83%
jan 1, 1976
8.921
+1.21
15.69%
jan 1, 1977
9.304
+0.383
4.29%
jan 1, 1978
9.604
+0.299
3.22%
jan 1, 1979
10.074
+0.47
4.9%
jan 1, 1980
10.689
+0.615
6.1%
jan 1, 1981
11.197
+0.508
4.75%
jan 1, 1982
11.73
+0.533
4.76%
jan 1, 1983
12.05
+0.32
2.73%
jan 1, 1984
12.475
+0.425
3.53%
jan 1, 1985
15.05
+2.575
20.64%
jan 1, 1986
15.765
+0.715
4.75%
jan 1, 1987
14.31
-1.455
-9.23%
jan 1, 1988
14.931
+0.621
4.34%
jan 1, 1989
15.341
+0.41
2.75%
jan 1, 1990
15.649
+0.308
2.01%
jan 1, 1991
15.807
+0.157
1.0%
jan 1, 1992
16.175
+0.369
2.33%
jan 1, 1993
16.133
-0.042
-0.26%
jan 1, 1994
16.115
-0.018
-0.11%
jan 1, 1995
16.401
+0.286
1.77%
jan 1, 1996
18.718
+2.317
14.13%
jan 1, 1997
17.807
-0.911
-4.87%
jan 1, 1998
20.515
+2.708
15.21%
jan 1, 1999
20.677
+0.162
0.79%
jan 1, 2000
23.197
+2.52
12.19%
jan 1, 2001
23.788
+0.591
2.55%
jan 1, 2002
25.328
+1.54
6.47%
jan 1, 2003
27.556
+2.229
8.8%
jan 1, 2004
29.535
+1.979
7.18%
jan 1, 2005
30.979
+1.444
4.89%
jan 1, 2006
32.841
+1.862
6.01%
jan 1, 2007
35.78
+2.94
8.95%
jan 1, 2008
38.57
+2.79
7.8%
jan 1, 2009
42.225
+3.655
9.48%
jan 1, 2010
43.558
+1.333
3.16%
jan 1, 2011
44.646
+1.088
2.5%
jan 1, 2012
46.931
+2.285
5.12%
jan 1, 2013
48.067
+1.136
2.42%
jan 1, 2014
48.941
+0.875
1.82%
jan 1, 2015
48.967
+0.026
0.05%
Ranking of countries by current statistics by years


Comments: