29
/
en
AIzaSyAYiBZKx7MnpbEhh9jyipgxe19OcubqV5w
April 1, 2024
105441
Chile
CHL
true
2
1
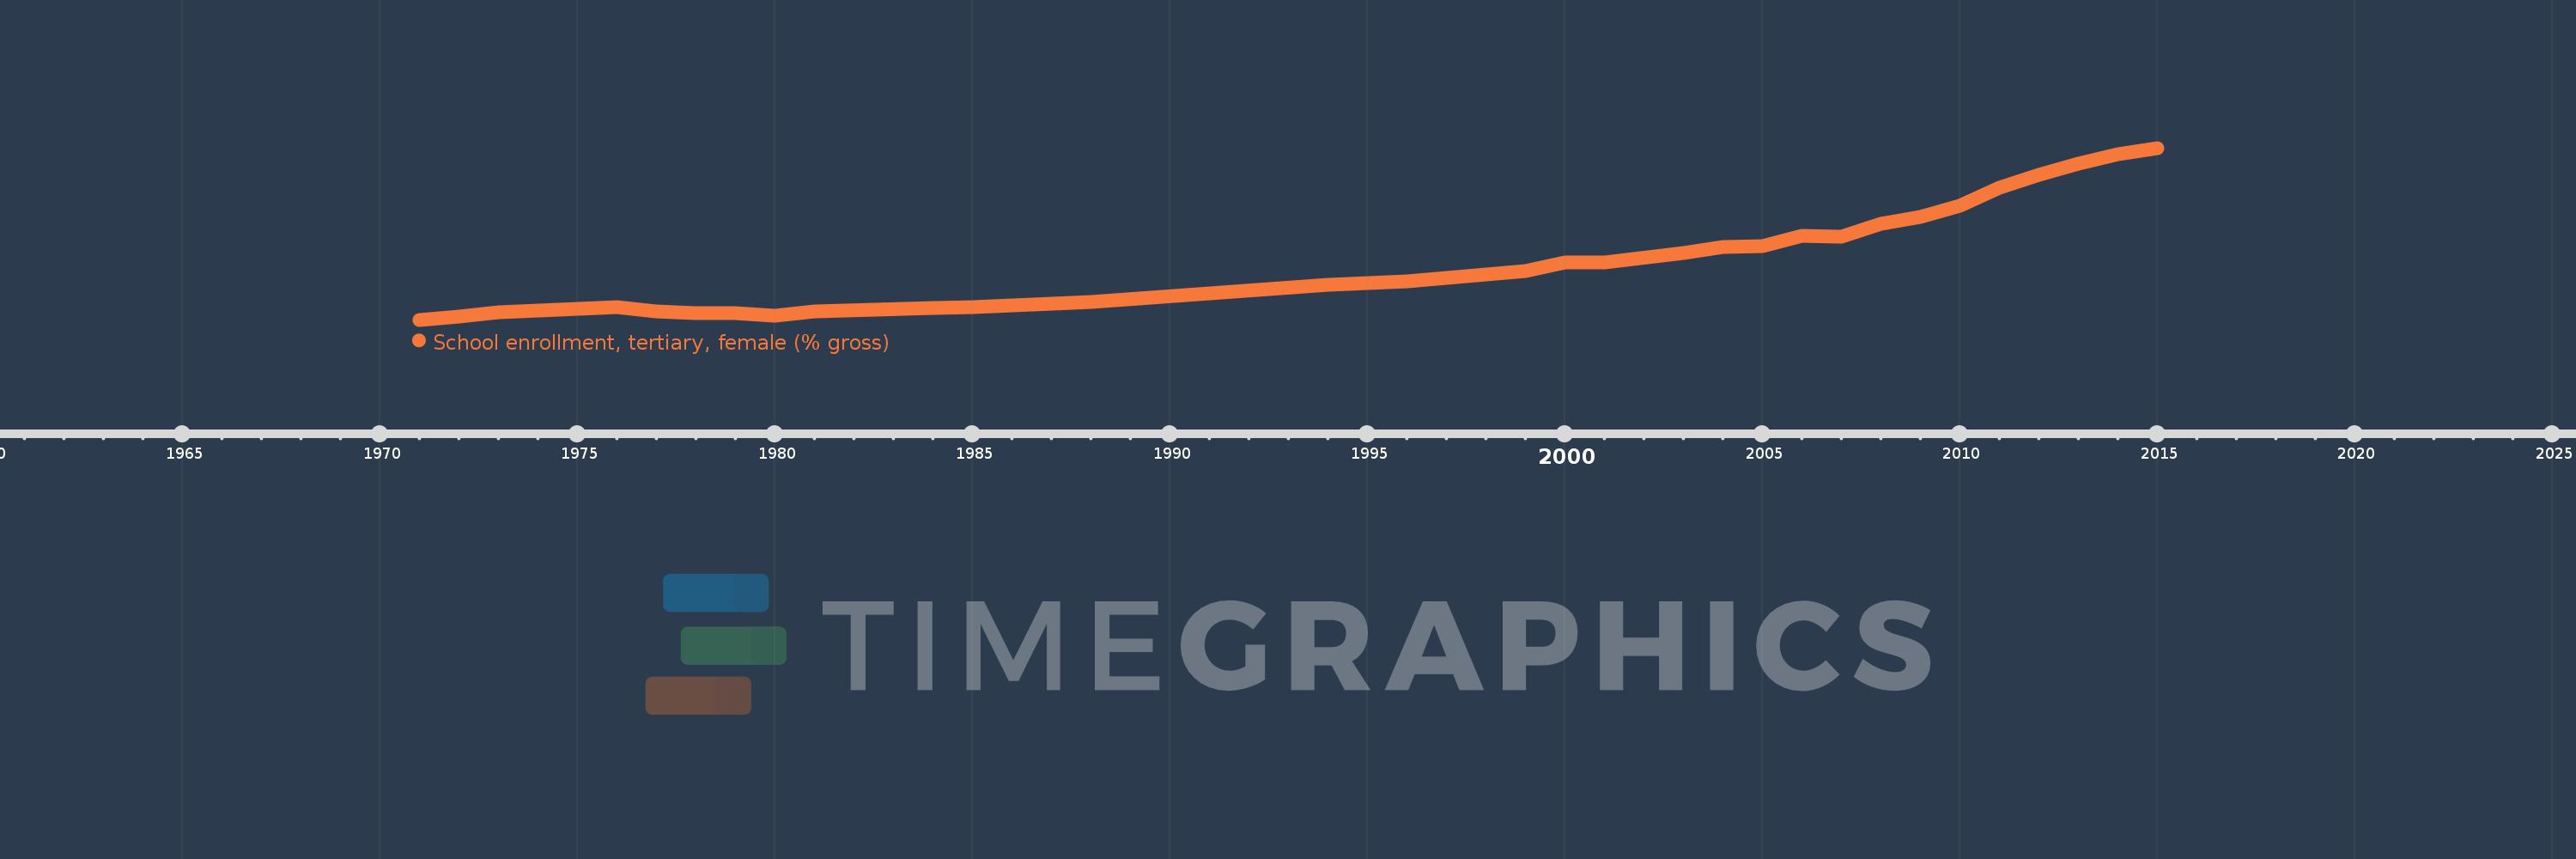
School enrollment, tertiary, female (% gross)
2015,2014,2013,2012,2011,2010,2009,2008,2007,2006,2005,2004,2003,2001,2000,1999,1998,1997,1996,1995,1994,1988,1987,1986,1985,1984,1981,1980,1979,1978,1977,1976,1973,1972,1971
This statistics in other country:
AfghanistanAlbaniaAlgeriaAngolaAntigua and BarbudaArab WorldArgentinaArmeniaArubaAustraliaAustriaAzerbaijanBahamas, TheBahrainBangladeshBarbadosBelarusBelgiumBelizeBeninBermudaBhutanBoliviaBosnia and HerzegovinaBotswanaBrazilBrunei DarussalamBulgariaBurkina FasoBurundiCabo VerdeCambodiaCameroonCanadaCaribbean small statesCentral African RepublicCentral Europe and the BalticsChadChileChinaColombiaComorosCongo, Dem. Rep.Congo, Rep.Costa RicaCote d'IvoireCroatiaCubaCuracaoCyprusCzech RepublicDenmarkDjiboutiDominicaDominican RepublicEarly-demographic dividendEast Asia & PacificEast Asia & Pacific (excluding high income)East Asia & Pacific (IDA & IBRD countries)EcuadorEgypt, Arab Rep.El SalvadorEquatorial GuineaEritreaEstoniaEthiopiaEuro areaEurope & Central AsiaEurope & Central Asia (excluding high income)Europe & Central Asia (IDA & IBRD countries)European UnionFijiFinlandFragile and conflict affected situationsFranceGabonGambia, TheGeorgiaGermanyGhanaGreeceGrenadaGuatemalaGuineaGuinea-BissauGuyanaHaitiHeavily indebted poor countries (HIPC)High incomeHondurasHong Kong SAR, ChinaHungaryIBRD onlyIcelandIDA & IBRD totalIDA blendIDA onlyIDA totalIndiaIndonesiaIran, Islamic Rep.IraqIrelandIsraelItalyJamaicaJapanJordanKazakhstanKenyaKorea, Dem. People’s Rep.Korea, Rep.KuwaitKyrgyz RepublicLao PDRLate-demographic dividendLatin America & Caribbean Latin America & Caribbean (excluding high income)Latin America & the Caribbean (IDA & IBRD countries)LatviaLeast developed countries: UN classificationLebanonLesothoLiberiaLibyaLiechtensteinLithuaniaLow & middle incomeLow incomeLower middle incomeLuxembourgMacao SAR, ChinaMacedonia, FYRMadagascarMalawiMaldivesMaliMaltaMarshall IslandsMauritaniaMauritiusMexicoMicronesia, Fed. Sts.Middle East & North AfricaMiddle East & North Africa (excluding high income)Middle East & North Africa (IDA & IBRD countries)Middle incomeMoldovaMongoliaMontenegroMoroccoMozambiqueMyanmarNamibiaNepalNetherlandsNew ZealandNicaraguaNigerNigeriaNorth AmericaNorwayOECD membersOmanOther small statesPacific island small statesPakistanPalauPanamaPapua New GuineaParaguayPeruPhilippinesPolandPortugalPost-demographic dividendPre-demographic dividendPuerto RicoQatarRomaniaRussian FederationRwandaSamoaSan MarinoSao Tome and PrincipeSaudi ArabiaSenegalSerbiaSeychellesSierra LeoneSingaporeSlovak RepublicSloveniaSmall statesSomaliaSouth AfricaSouth AsiaSouth Asia (IDA & IBRD)SpainSri LankaSt. Kitts and NevisSt. LuciaSt. Vincent and the GrenadinesSub-Saharan Africa Sub-Saharan Africa (excluding high income)Sub-Saharan Africa (IDA & IBRD countries)SudanSurinameSwazilandSwedenSwitzerlandSyrian Arab RepublicTajikistanTanzaniaThailandTimor-LesteTogoTongaTrinidad and TobagoTunisiaTurkeyTurkmenistanUgandaUkraineUnited Arab EmiratesUnited KingdomUnited StatesUpper middle incomeUruguayUzbekistanVanuatuVenezuela, RBVietnamWest Bank and GazaWorldYemen, Rep.ZambiaZimbabwe Timeline:
This timeline shows a graph from 1971 to 2015 of Chile. No data until 1970. Number of actual observations by date: 35.
Source name:
World Development Indicators
Source organization:
United Nations Educational, Scientific, and Cultural Organization (UNESCO) Institute for Statistics.
Categories, topics:
Education, Gender
Last updated:
apr 23, 2017
Indicators value changes by year
Maximum:
92.279
jan 1, 2015
At the date of observation
Value
Absolute change
Change from previous value
jan 1, 1971
6.95
+6.95
0.0%
jan 1, 1972
8.579
+1.629
23.44%
jan 1, 1973
10.537
+1.958
22.82%
jan 1, 1976
13.179
+2.642
25.08%
jan 1, 1977
10.898
-2.281
-17.31%
jan 1, 1978
10.36
-0.538
-4.94%
jan 1, 1979
10.107
-0.253
-2.45%
jan 1, 1980
9.08
-1.027
-10.16%
jan 1, 1981
11.107
+2.028
22.33%
jan 1, 1984
12.685
+1.577
14.2%
jan 1, 1985
13.33
+0.646
5.09%
jan 1, 1986
13.914
+0.584
4.38%
jan 1, 1987
15.073
+1.158
8.32%
jan 1, 1988
15.794
+0.721
4.78%
jan 1, 1994
24.207
+8.413
53.27%
jan 1, 1995
25.334
+1.128
4.66%
jan 1, 1996
26.078
+0.744
2.94%
jan 1, 1997
27.89
+1.812
6.95%
jan 1, 1998
29.336
+1.446
5.18%
jan 1, 1999
31.329
+1.993
6.79%
jan 1, 2000
35.383
+4.054
12.94%
jan 1, 2001
35.262
-0.121
-0.34%
jan 1, 2003
39.963
+4.701
13.33%
jan 1, 2004
43.014
+3.051
7.63%
jan 1, 2005
43.346
+0.332
0.77%
jan 1, 2006
48.623
+5.277
12.17%
jan 1, 2007
48.359
-0.265
-0.54%
jan 1, 2008
54.401
+6.042
12.49%
jan 1, 2009
58.027
+3.626
6.67%
jan 1, 2010
63.779
+5.751
9.91%
jan 1, 2011
72.326
+8.547
13.4%
jan 1, 2012
78.935
+6.61
9.14%
jan 1, 2013
84.404
+5.469
6.93%
jan 1, 2014
88.96
+4.555
5.4%
jan 1, 2015
92.279
+3.319
3.73%
Ranking of countries by current statistics by years


Comments: