29
/
en
AIzaSyAYiBZKx7MnpbEhh9jyipgxe19OcubqV5w
April 1, 2024
38576
IDA blend
IDB
false
2
1
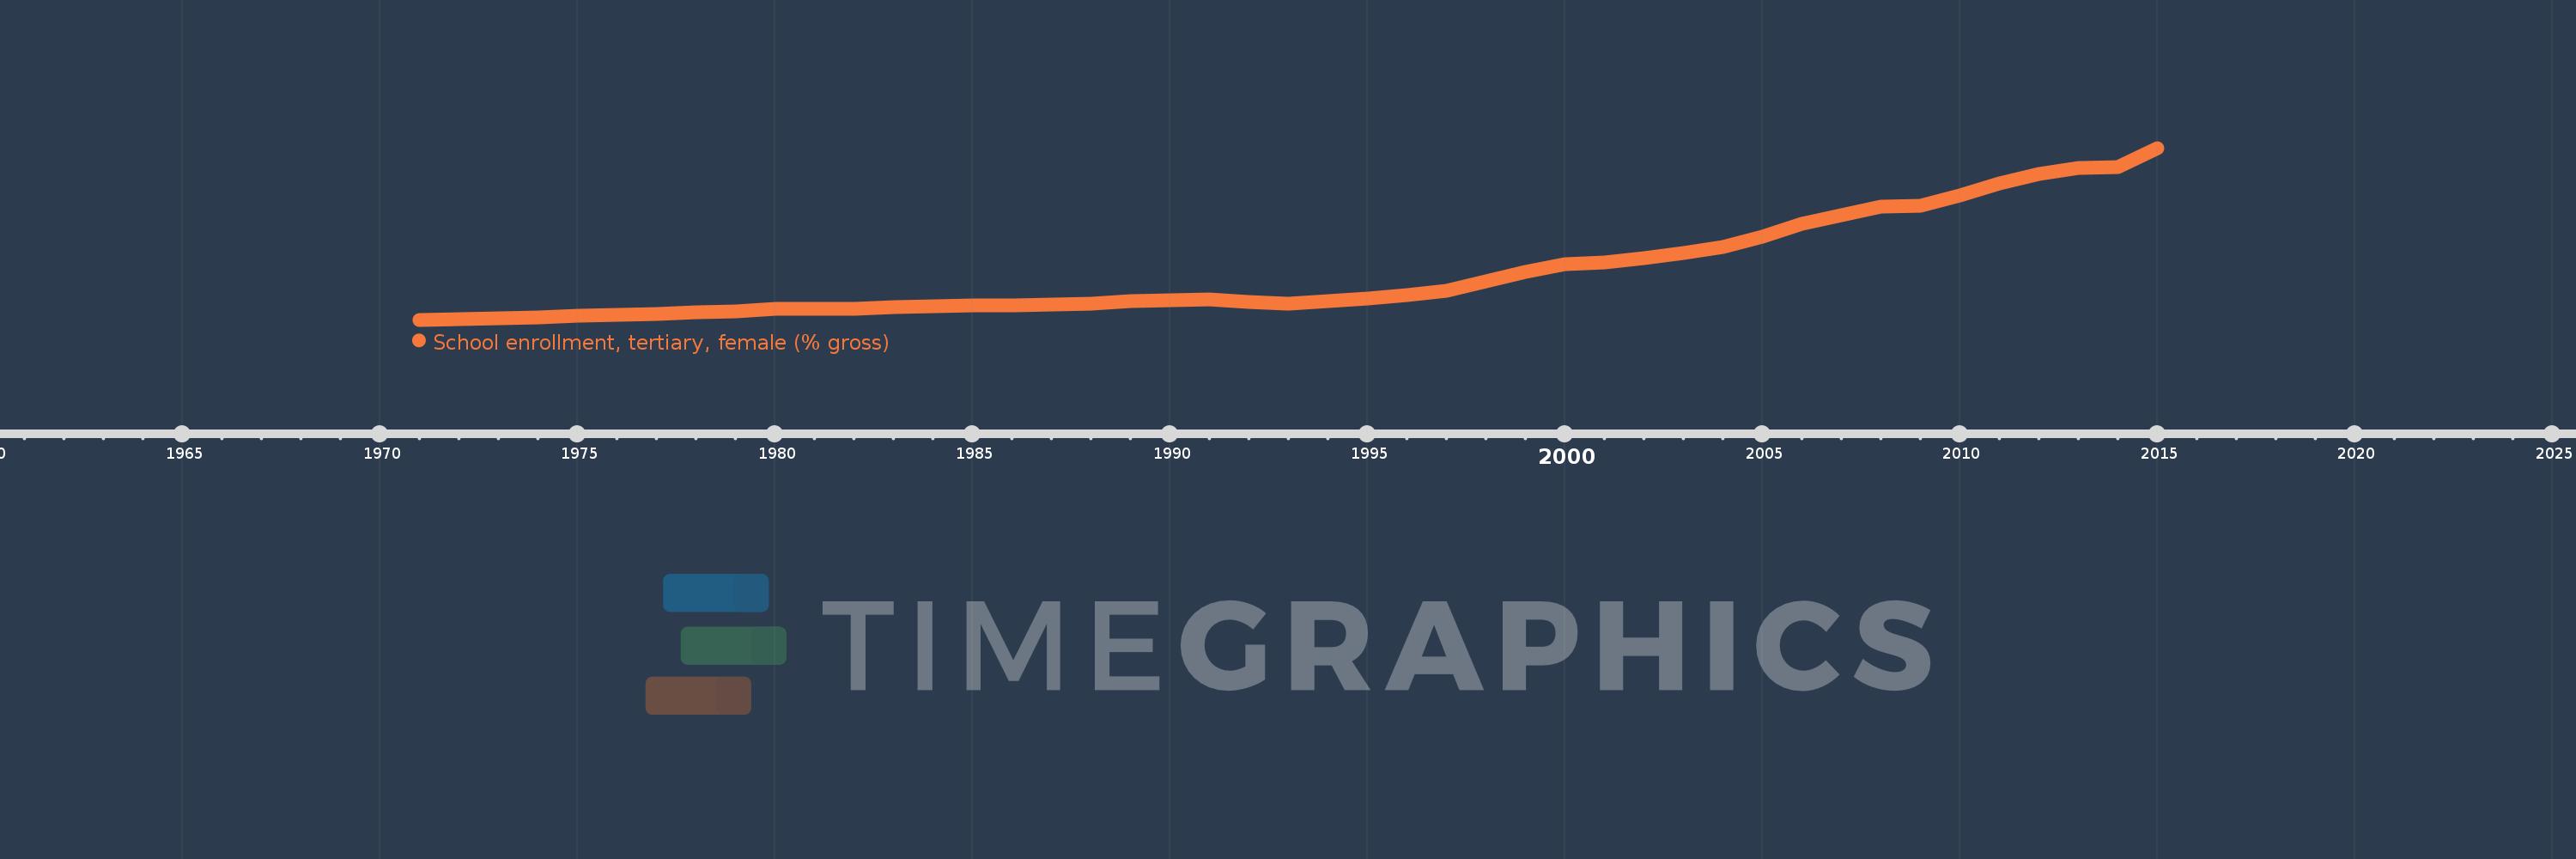
School enrollment, tertiary, female (% gross)
2015,2014,2013,2012,2011,2010,2009,2008,2007,2006,2005,2004,2003,2002,2001,2000,1999,1998,1997,1996,1995,1994,1993,1992,1991,1990,1989,1988,1987,1986,1985,1984,1983,1982,1981,1980,1979,1978,1977,1976,1975,1974,1973,1972,1971
This statistics in other country:
AfghanistanAlbaniaAlgeriaAngolaAntigua and BarbudaArab WorldArgentinaArmeniaArubaAustraliaAustriaAzerbaijanBahamas, TheBahrainBangladeshBarbadosBelarusBelgiumBelizeBeninBermudaBhutanBoliviaBosnia and HerzegovinaBotswanaBrazilBrunei DarussalamBulgariaBurkina FasoBurundiCabo VerdeCambodiaCameroonCanadaCaribbean small statesCentral African RepublicCentral Europe and the BalticsChadChileChinaColombiaComorosCongo, Dem. Rep.Congo, Rep.Costa RicaCote d'IvoireCroatiaCubaCuracaoCyprusCzech RepublicDenmarkDjiboutiDominicaDominican RepublicEarly-demographic dividendEast Asia & PacificEast Asia & Pacific (excluding high income)East Asia & Pacific (IDA & IBRD countries)EcuadorEgypt, Arab Rep.El SalvadorEquatorial GuineaEritreaEstoniaEthiopiaEuro areaEurope & Central AsiaEurope & Central Asia (excluding high income)Europe & Central Asia (IDA & IBRD countries)European UnionFijiFinlandFragile and conflict affected situationsFranceGabonGambia, TheGeorgiaGermanyGhanaGreeceGrenadaGuatemalaGuineaGuinea-BissauGuyanaHaitiHeavily indebted poor countries (HIPC)High incomeHondurasHong Kong SAR, ChinaHungaryIBRD onlyIcelandIDA & IBRD totalIDA blendIDA onlyIDA totalIndiaIndonesiaIran, Islamic Rep.IraqIrelandIsraelItalyJamaicaJapanJordanKazakhstanKenyaKorea, Dem. People’s Rep.Korea, Rep.KuwaitKyrgyz RepublicLao PDRLate-demographic dividendLatin America & Caribbean Latin America & Caribbean (excluding high income)Latin America & the Caribbean (IDA & IBRD countries)LatviaLeast developed countries: UN classificationLebanonLesothoLiberiaLibyaLiechtensteinLithuaniaLow & middle incomeLow incomeLower middle incomeLuxembourgMacao SAR, ChinaMacedonia, FYRMadagascarMalawiMaldivesMaliMaltaMarshall IslandsMauritaniaMauritiusMexicoMicronesia, Fed. Sts.Middle East & North AfricaMiddle East & North Africa (excluding high income)Middle East & North Africa (IDA & IBRD countries)Middle incomeMoldovaMongoliaMontenegroMoroccoMozambiqueMyanmarNamibiaNepalNetherlandsNew ZealandNicaraguaNigerNigeriaNorth AmericaNorwayOECD membersOmanOther small statesPacific island small statesPakistanPalauPanamaPapua New GuineaParaguayPeruPhilippinesPolandPortugalPost-demographic dividendPre-demographic dividendPuerto RicoQatarRomaniaRussian FederationRwandaSamoaSan MarinoSao Tome and PrincipeSaudi ArabiaSenegalSerbiaSeychellesSierra LeoneSingaporeSlovak RepublicSloveniaSmall statesSomaliaSouth AfricaSouth AsiaSouth Asia (IDA & IBRD)SpainSri LankaSt. Kitts and NevisSt. LuciaSt. Vincent and the GrenadinesSub-Saharan Africa Sub-Saharan Africa (excluding high income)Sub-Saharan Africa (IDA & IBRD countries)SudanSurinameSwazilandSwedenSwitzerlandSyrian Arab RepublicTajikistanTanzaniaThailandTimor-LesteTogoTongaTrinidad and TobagoTunisiaTurkeyTurkmenistanUgandaUkraineUnited Arab EmiratesUnited KingdomUnited StatesUpper middle incomeUruguayUzbekistanVanuatuVenezuela, RBVietnamWest Bank and GazaWorldYemen, Rep.ZambiaZimbabwe Timeline:
This timeline shows a graph from 1971 to 2015 of IDA blend. No data until 1970. Number of actual observations by date: 45.
Source name:
World Development Indicators
Source organization:
United Nations Educational, Scientific, and Cultural Organization (UNESCO) Institute for Statistics.
Categories, topics:
Education, Gender
Last updated:
apr 23, 2017
Indicators value changes by year
Maximum:
14.294
jan 1, 2015
At the date of observation
Value
Absolute change
Change from previous value
jan 1, 1971
2.253
+2.253
0.0%
jan 1, 1972
2.3
+0.047
2.1%
jan 1, 1973
2.359
+0.059
2.56%
jan 1, 1974
2.442
+0.083
3.5%
jan 1, 1975
2.545
+0.103
4.21%
jan 1, 1976
2.613
+0.068
2.68%
jan 1, 1977
2.681
+0.068
2.6%
jan 1, 1978
2.754
+0.073
2.71%
jan 1, 1979
2.841
+0.087
3.17%
jan 1, 1980
3.004
+0.164
5.76%
jan 1, 1981
3.003
-0.002
-0.06%
jan 1, 1982
3.033
+0.03
1.01%
jan 1, 1983
3.163
+0.13
4.27%
jan 1, 1984
3.208
+0.045
1.44%
jan 1, 1985
3.25
+0.042
1.29%
jan 1, 1986
3.285
+0.035
1.09%
jan 1, 1987
3.325
+0.04
1.21%
jan 1, 1988
3.399
+0.074
2.23%
jan 1, 1989
3.549
+0.15
4.4%
jan 1, 1990
3.598
+0.049
1.39%
jan 1, 1991
3.697
+0.099
2.74%
jan 1, 1992
3.506
-0.191
-5.16%
jan 1, 1993
3.406
-0.099
-2.83%
jan 1, 1994
3.554
+0.148
4.34%
jan 1, 1995
3.71
+0.156
4.4%
jan 1, 1996
3.965
+0.255
6.87%
jan 1, 1997
4.302
+0.336
8.49%
jan 1, 1998
4.941
+0.64
14.87%
jan 1, 1999
5.594
+0.652
13.2%
jan 1, 2000
6.144
+0.55
9.83%
jan 1, 2001
6.243
+0.1
1.63%
jan 1, 2002
6.574
+0.331
5.3%
jan 1, 2003
6.956
+0.382
5.81%
jan 1, 2004
7.33
+0.373
5.37%
jan 1, 2005
8.087
+0.758
10.34%
jan 1, 2006
8.97
+0.883
10.91%
jan 1, 2007
9.586
+0.616
6.87%
jan 1, 2008
10.17
+0.583
6.08%
jan 1, 2009
10.264
+0.095
0.93%
jan 1, 2010
10.942
+0.678
6.6%
jan 1, 2011
11.807
+0.865
7.9%
jan 1, 2012
12.446
+0.64
5.42%
jan 1, 2013
12.867
+0.42
3.38%
jan 1, 2014
12.957
+0.09
0.7%
jan 1, 2015
14.294
+1.337
10.32%
Ranking of countries by current statistics by years


Comments: