29
/
en
AIzaSyAYiBZKx7MnpbEhh9jyipgxe19OcubqV5w
April 1, 2024
90511
Botswana
BWA
true
2
1
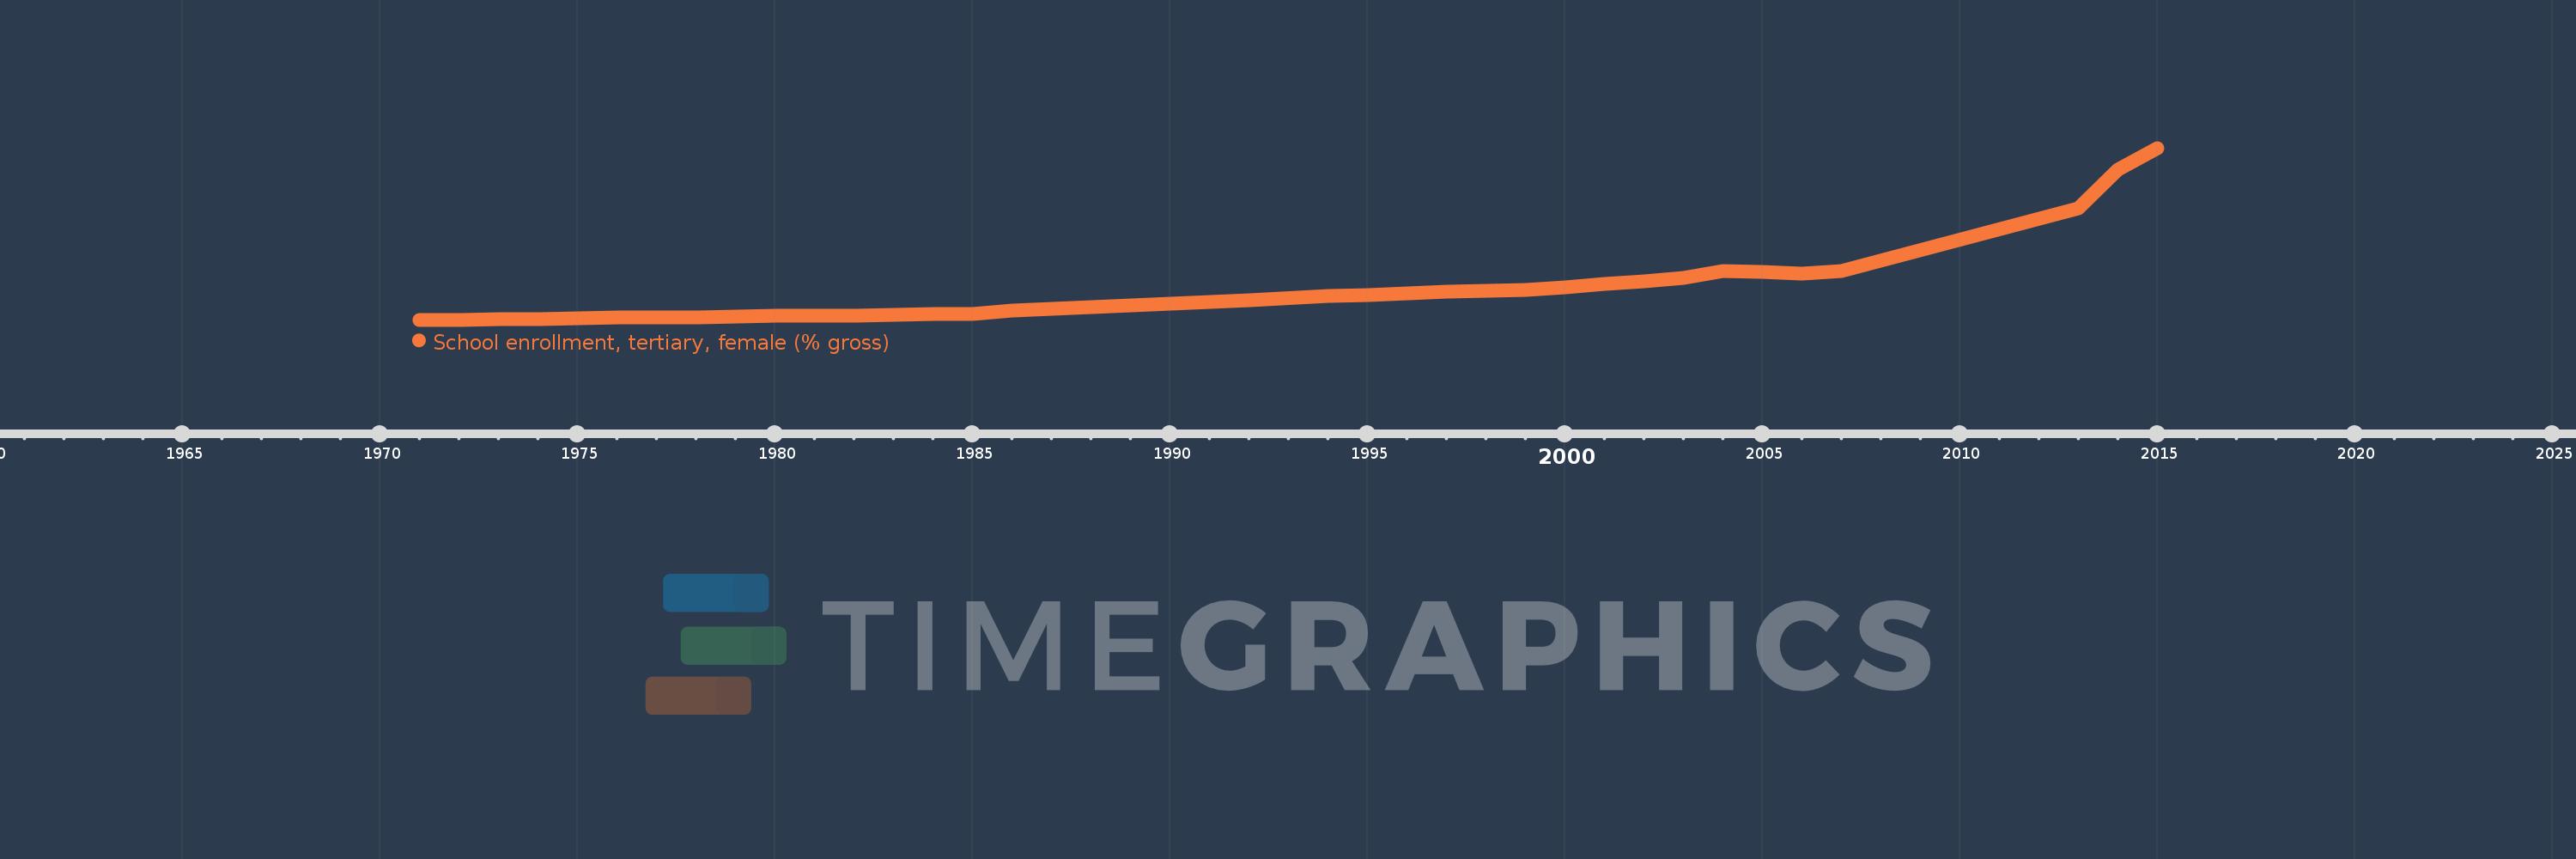
School enrollment, tertiary, female (% gross)
2015,2014,2013,2007,2006,2005,2004,2003,2002,2001,2000,1999,1997,1996,1995,1994,1992,1988,1986,1985,1984,1983,1982,1981,1980,1979,1978,1977,1976,1975,1974,1973,1972,1971
This statistics in other country:
AfghanistanAlbaniaAlgeriaAngolaAntigua and BarbudaArab WorldArgentinaArmeniaArubaAustraliaAustriaAzerbaijanBahamas, TheBahrainBangladeshBarbadosBelarusBelgiumBelizeBeninBermudaBhutanBoliviaBosnia and HerzegovinaBotswanaBrazilBrunei DarussalamBulgariaBurkina FasoBurundiCabo VerdeCambodiaCameroonCanadaCaribbean small statesCentral African RepublicCentral Europe and the BalticsChadChileChinaColombiaComorosCongo, Dem. Rep.Congo, Rep.Costa RicaCote d'IvoireCroatiaCubaCuracaoCyprusCzech RepublicDenmarkDjiboutiDominicaDominican RepublicEarly-demographic dividendEast Asia & PacificEast Asia & Pacific (excluding high income)East Asia & Pacific (IDA & IBRD countries)EcuadorEgypt, Arab Rep.El SalvadorEquatorial GuineaEritreaEstoniaEthiopiaEuro areaEurope & Central AsiaEurope & Central Asia (excluding high income)Europe & Central Asia (IDA & IBRD countries)European UnionFijiFinlandFragile and conflict affected situationsFranceGabonGambia, TheGeorgiaGermanyGhanaGreeceGrenadaGuatemalaGuineaGuinea-BissauGuyanaHaitiHeavily indebted poor countries (HIPC)High incomeHondurasHong Kong SAR, ChinaHungaryIBRD onlyIcelandIDA & IBRD totalIDA blendIDA onlyIDA totalIndiaIndonesiaIran, Islamic Rep.IraqIrelandIsraelItalyJamaicaJapanJordanKazakhstanKenyaKorea, Dem. People’s Rep.Korea, Rep.KuwaitKyrgyz RepublicLao PDRLate-demographic dividendLatin America & Caribbean Latin America & Caribbean (excluding high income)Latin America & the Caribbean (IDA & IBRD countries)LatviaLeast developed countries: UN classificationLebanonLesothoLiberiaLibyaLiechtensteinLithuaniaLow & middle incomeLow incomeLower middle incomeLuxembourgMacao SAR, ChinaMacedonia, FYRMadagascarMalawiMaldivesMaliMaltaMarshall IslandsMauritaniaMauritiusMexicoMicronesia, Fed. Sts.Middle East & North AfricaMiddle East & North Africa (excluding high income)Middle East & North Africa (IDA & IBRD countries)Middle incomeMoldovaMongoliaMontenegroMoroccoMozambiqueMyanmarNamibiaNepalNetherlandsNew ZealandNicaraguaNigerNigeriaNorth AmericaNorwayOECD membersOmanOther small statesPacific island small statesPakistanPalauPanamaPapua New GuineaParaguayPeruPhilippinesPolandPortugalPost-demographic dividendPre-demographic dividendPuerto RicoQatarRomaniaRussian FederationRwandaSamoaSan MarinoSao Tome and PrincipeSaudi ArabiaSenegalSerbiaSeychellesSierra LeoneSingaporeSlovak RepublicSloveniaSmall statesSomaliaSouth AfricaSouth AsiaSouth Asia (IDA & IBRD)SpainSri LankaSt. Kitts and NevisSt. LuciaSt. Vincent and the GrenadinesSub-Saharan Africa Sub-Saharan Africa (excluding high income)Sub-Saharan Africa (IDA & IBRD countries)SudanSurinameSwazilandSwedenSwitzerlandSyrian Arab RepublicTajikistanTanzaniaThailandTimor-LesteTogoTongaTrinidad and TobagoTunisiaTurkeyTurkmenistanUgandaUkraineUnited Arab EmiratesUnited KingdomUnited StatesUpper middle incomeUruguayUzbekistanVanuatuVenezuela, RBVietnamWest Bank and GazaWorldYemen, Rep.ZambiaZimbabwe Timeline:
This timeline shows a graph from 1971 to 2015 of Botswana. No data until 1970. Number of actual observations by date: 34.
Source name:
World Development Indicators
Source organization:
United Nations Educational, Scientific, and Cultural Organization (UNESCO) Institute for Statistics.
Categories, topics:
Education, Gender
Last updated:
apr 23, 2017
Indicators value changes by year
Maximum:
31.828
jan 1, 2015
At the date of observation
Value
Absolute change
Change from previous value
jan 1, 1973
0.169
+0.169
%
jan 1, 1974
0.189
+0.02
12.08%
jan 1, 1975
0.245
+0.055
29.31%
jan 1, 1976
0.37
+0.125
51.05%
jan 1, 1977
0.427
+0.057
15.47%
jan 1, 1978
0.5
+0.073
17.22%
jan 1, 1979
0.579
+0.079
15.73%
jan 1, 1980
0.691
+0.112
19.37%
jan 1, 1981
0.776
+0.085
12.31%
jan 1, 1982
0.806
+0.03
3.91%
jan 1, 1983
0.867
+0.061
7.54%
jan 1, 1984
0.988
+0.121
13.93%
jan 1, 1985
1.086
+0.098
9.95%
jan 1, 1986
1.654
+0.568
52.26%
jan 1, 1988
2.261
+0.607
36.71%
jan 1, 1992
3.533
+1.271
56.21%
jan 1, 1994
4.387
+0.854
24.18%
jan 1, 1995
4.534
+0.147
3.35%
jan 1, 1996
4.833
+0.299
6.6%
jan 1, 1997
5.176
+0.343
7.11%
jan 1, 1999
5.559
+0.383
7.4%
jan 1, 2000
5.928
+0.369
6.64%
jan 1, 2001
6.658
+0.73
12.32%
jan 1, 2002
7.147
+0.489
7.34%
jan 1, 2003
7.754
+0.608
8.5%
jan 1, 2004
9.018
+1.264
16.3%
jan 1, 2005
8.942
-0.076
-0.85%
jan 1, 2006
8.618
-0.324
-3.62%
jan 1, 2007
8.997
+0.379
4.4%
jan 1, 2013
20.618
+11.621
129.16%
jan 1, 2014
27.793
+7.175
34.8%
jan 1, 2015
31.828
+4.035
14.52%
Ranking of countries by current statistics by years


Comments: