29
/
en
AIzaSyAYiBZKx7MnpbEhh9jyipgxe19OcubqV5w
April 1, 2024
227866
Qatar
QAT
true
2
1
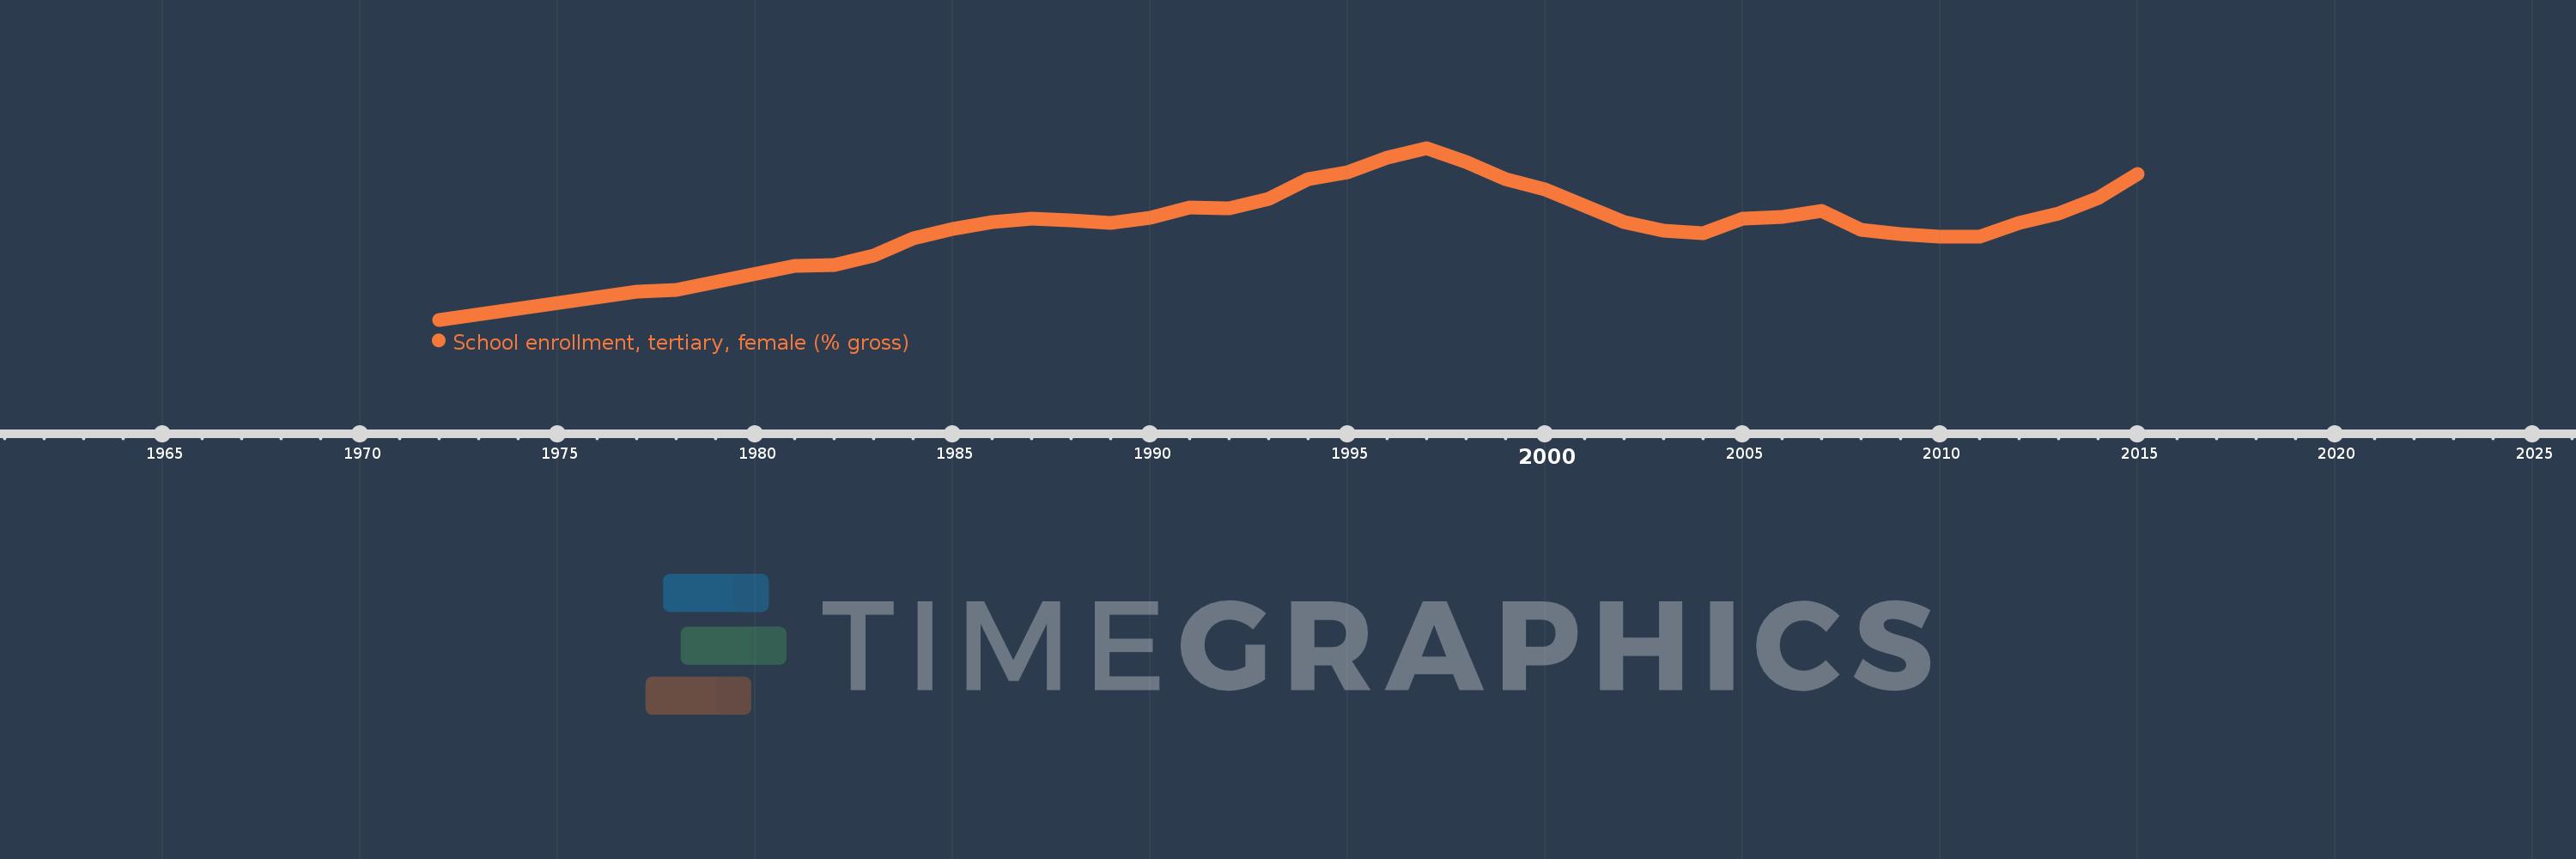
School enrollment, tertiary, female (% gross)
2015,2014,2013,2012,2011,2010,2009,2008,2007,2006,2005,2004,2003,2002,2000,1999,1998,1997,1996,1995,1994,1993,1992,1991,1990,1989,1988,1987,1986,1985,1984,1983,1982,1981,1978,1977,1972
This statistics in other country:
AfghanistanAlbaniaAlgeriaAngolaAntigua and BarbudaArab WorldArgentinaArmeniaArubaAustraliaAustriaAzerbaijanBahamas, TheBahrainBangladeshBarbadosBelarusBelgiumBelizeBeninBermudaBhutanBoliviaBosnia and HerzegovinaBotswanaBrazilBrunei DarussalamBulgariaBurkina FasoBurundiCabo VerdeCambodiaCameroonCanadaCaribbean small statesCentral African RepublicCentral Europe and the BalticsChadChileChinaColombiaComorosCongo, Dem. Rep.Congo, Rep.Costa RicaCote d'IvoireCroatiaCubaCuracaoCyprusCzech RepublicDenmarkDjiboutiDominicaDominican RepublicEarly-demographic dividendEast Asia & PacificEast Asia & Pacific (excluding high income)East Asia & Pacific (IDA & IBRD countries)EcuadorEgypt, Arab Rep.El SalvadorEquatorial GuineaEritreaEstoniaEthiopiaEuro areaEurope & Central AsiaEurope & Central Asia (excluding high income)Europe & Central Asia (IDA & IBRD countries)European UnionFijiFinlandFragile and conflict affected situationsFranceGabonGambia, TheGeorgiaGermanyGhanaGreeceGrenadaGuatemalaGuineaGuinea-BissauGuyanaHaitiHeavily indebted poor countries (HIPC)High incomeHondurasHong Kong SAR, ChinaHungaryIBRD onlyIcelandIDA & IBRD totalIDA blendIDA onlyIDA totalIndiaIndonesiaIran, Islamic Rep.IraqIrelandIsraelItalyJamaicaJapanJordanKazakhstanKenyaKorea, Dem. People’s Rep.Korea, Rep.KuwaitKyrgyz RepublicLao PDRLate-demographic dividendLatin America & Caribbean Latin America & Caribbean (excluding high income)Latin America & the Caribbean (IDA & IBRD countries)LatviaLeast developed countries: UN classificationLebanonLesothoLiberiaLibyaLiechtensteinLithuaniaLow & middle incomeLow incomeLower middle incomeLuxembourgMacao SAR, ChinaMacedonia, FYRMadagascarMalawiMaldivesMaliMaltaMarshall IslandsMauritaniaMauritiusMexicoMicronesia, Fed. Sts.Middle East & North AfricaMiddle East & North Africa (excluding high income)Middle East & North Africa (IDA & IBRD countries)Middle incomeMoldovaMongoliaMontenegroMoroccoMozambiqueMyanmarNamibiaNepalNetherlandsNew ZealandNicaraguaNigerNigeriaNorth AmericaNorwayOECD membersOmanOther small statesPacific island small statesPakistanPalauPanamaPapua New GuineaParaguayPeruPhilippinesPolandPortugalPost-demographic dividendPre-demographic dividendPuerto RicoQatarRomaniaRussian FederationRwandaSamoaSan MarinoSao Tome and PrincipeSaudi ArabiaSenegalSerbiaSeychellesSierra LeoneSingaporeSlovak RepublicSloveniaSmall statesSomaliaSouth AfricaSouth AsiaSouth Asia (IDA & IBRD)SpainSri LankaSt. Kitts and NevisSt. LuciaSt. Vincent and the GrenadinesSub-Saharan Africa Sub-Saharan Africa (excluding high income)Sub-Saharan Africa (IDA & IBRD countries)SudanSurinameSwazilandSwedenSwitzerlandSyrian Arab RepublicTajikistanTanzaniaThailandTimor-LesteTogoTongaTrinidad and TobagoTunisiaTurkeyTurkmenistanUgandaUkraineUnited Arab EmiratesUnited KingdomUnited StatesUpper middle incomeUruguayUzbekistanVanuatuVenezuela, RBVietnamWest Bank and GazaWorldYemen, Rep.ZambiaZimbabwe Timeline:
This timeline shows a graph from 1972 to 2015 of Qatar. No data until 1971. Number of actual observations by date: 37.
Source name:
World Development Indicators
Source organization:
United Nations Educational, Scientific, and Cultural Organization (UNESCO) Institute for Statistics.
Categories, topics:
Education, Gender
Last updated:
apr 23, 2017
Indicators value changes by year
Maximum:
54.064
jan 1, 1997
At the date of observation
Value
Absolute change
Change from previous value
jan 1, 1977
8.974
+8.974
%
jan 1, 1978
9.255
+0.281
3.13%
jan 1, 1981
16.968
+7.713
83.34%
jan 1, 1982
17.213
+0.244
1.44%
jan 1, 1983
20.106
+2.894
16.81%
jan 1, 1984
25.717
+5.611
27.9%
jan 1, 1985
28.449
+2.732
10.62%
jan 1, 1986
30.702
+2.253
7.92%
jan 1, 1987
31.937
+1.235
4.02%
jan 1, 1988
31.351
-0.586
-1.84%
jan 1, 1989
30.517
-0.834
-2.66%
jan 1, 1990
32.143
+1.627
5.33%
jan 1, 1991
35.399
+3.256
10.13%
jan 1, 1992
35.0
-0.399
-1.13%
jan 1, 1993
38.132
+3.132
8.95%
jan 1, 1994
44.376
+6.244
16.37%
jan 1, 1995
46.396
+2.02
4.55%
jan 1, 1996
50.902
+4.506
9.71%
jan 1, 1997
54.064
+3.161
6.21%
jan 1, 1998
49.671
-4.392
-8.12%
jan 1, 1999
44.315
-5.356
-10.78%
jan 1, 2000
40.9
-3.415
-7.71%
jan 1, 2002
30.808
-10.092
-24.67%
jan 1, 2003
28.131
-2.677
-8.69%
jan 1, 2004
27.291
-0.84
-2.99%
jan 1, 2005
31.764
+4.473
16.39%
jan 1, 2006
32.267
+0.503
1.58%
jan 1, 2007
34.337
+2.07
6.41%
jan 1, 2008
28.33
-6.007
-17.49%
jan 1, 2009
26.913
-1.417
-5.0%
jan 1, 2010
26.081
-0.832
-3.09%
jan 1, 2011
26.248
+0.167
0.64%
jan 1, 2012
30.529
+4.281
16.31%
jan 1, 2013
33.338
+2.809
9.2%
jan 1, 2014
38.368
+5.029
15.09%
jan 1, 2015
45.848
+7.48
19.5%
Ranking of countries by current statistics by years


Comments: