29
/
en
AIzaSyAYiBZKx7MnpbEhh9jyipgxe19OcubqV5w
April 1, 2024
82217
Belgium
BEL
true
2
1
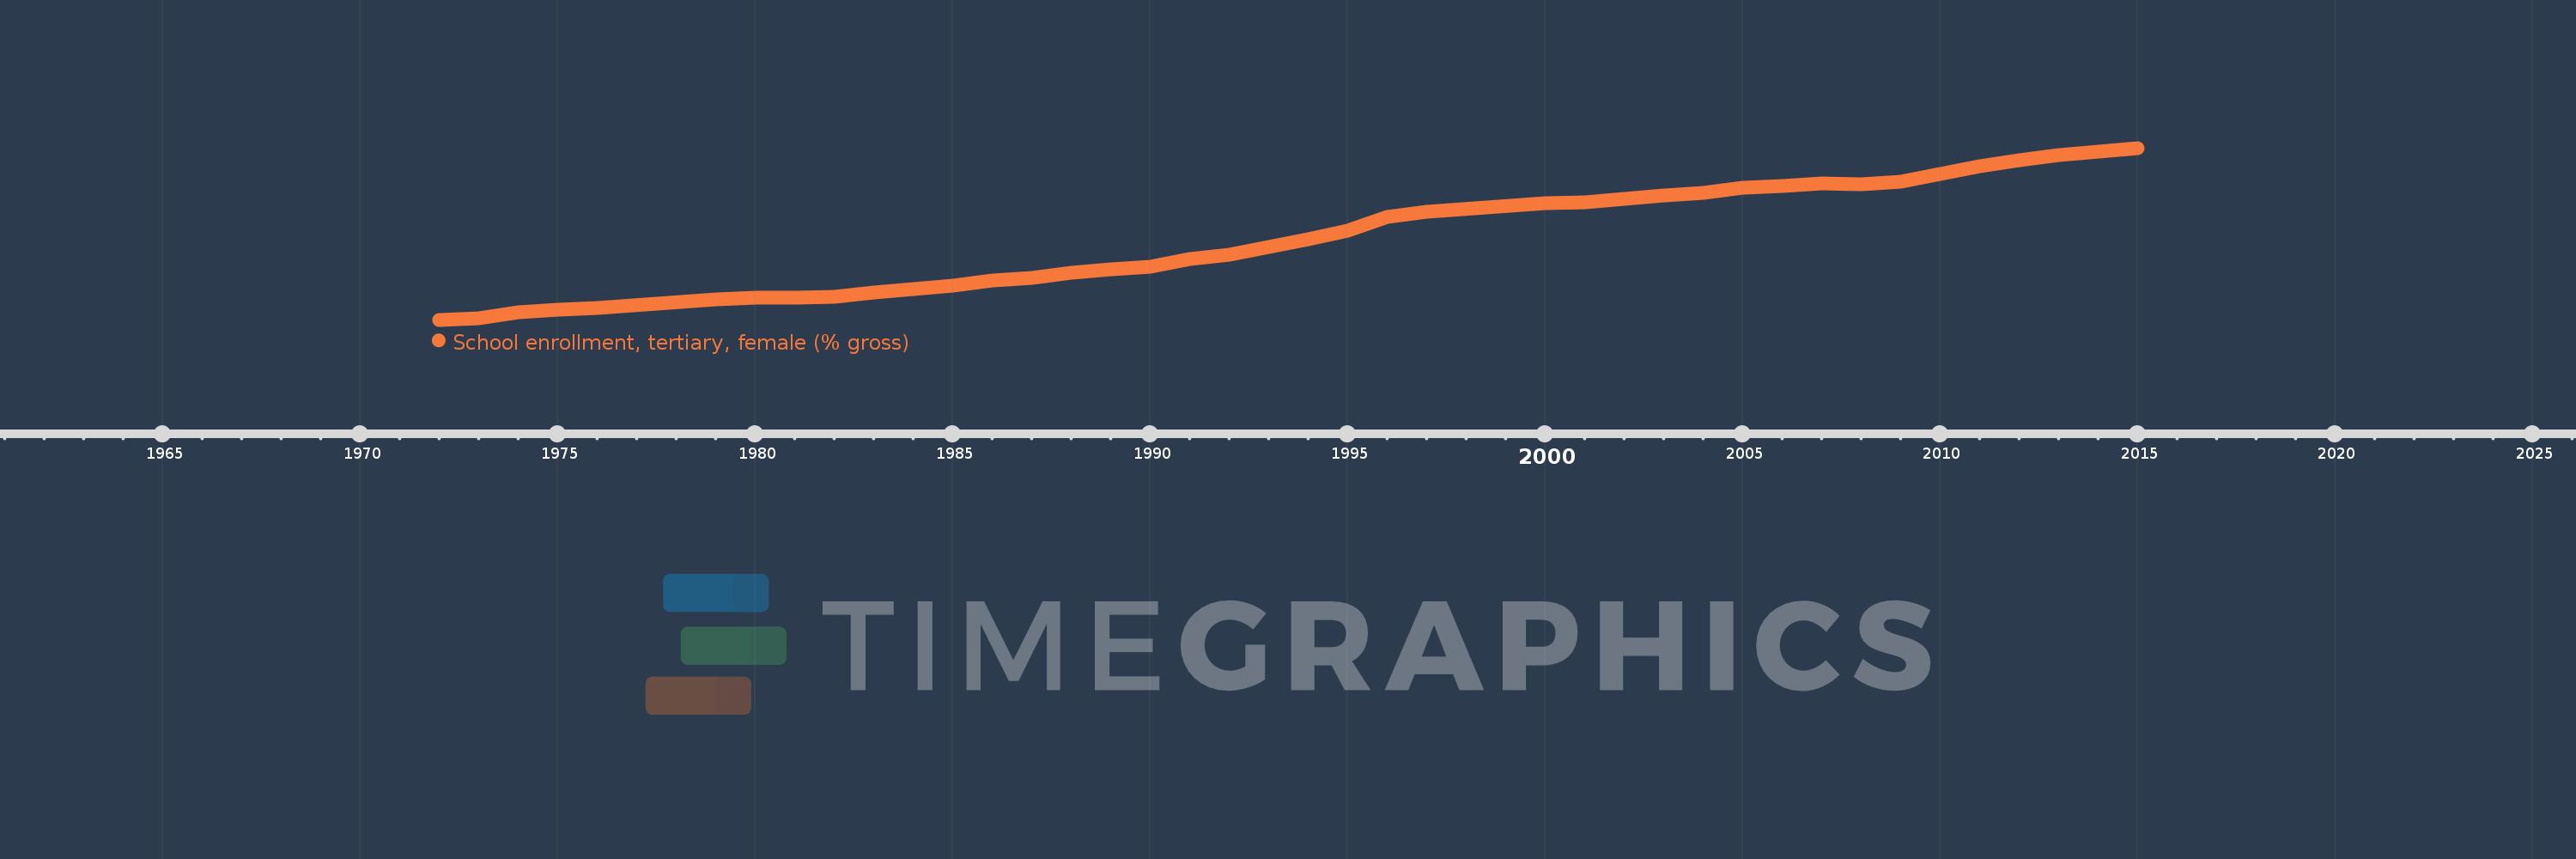
School enrollment, tertiary, female (% gross)
2015,2014,2013,2012,2011,2010,2009,2008,2007,2006,2005,2004,2003,2002,2001,2000,1997,1996,1995,1994,1992,1991,1990,1989,1988,1987,1986,1985,1984,1983,1982,1981,1980,1979,1976,1975,1974,1973,1972
This statistics in other country:
AfghanistanAlbaniaAlgeriaAngolaAntigua and BarbudaArab WorldArgentinaArmeniaArubaAustraliaAustriaAzerbaijanBahamas, TheBahrainBangladeshBarbadosBelarusBelgiumBelizeBeninBermudaBhutanBoliviaBosnia and HerzegovinaBotswanaBrazilBrunei DarussalamBulgariaBurkina FasoBurundiCabo VerdeCambodiaCameroonCanadaCaribbean small statesCentral African RepublicCentral Europe and the BalticsChadChileChinaColombiaComorosCongo, Dem. Rep.Congo, Rep.Costa RicaCote d'IvoireCroatiaCubaCuracaoCyprusCzech RepublicDenmarkDjiboutiDominicaDominican RepublicEarly-demographic dividendEast Asia & PacificEast Asia & Pacific (excluding high income)East Asia & Pacific (IDA & IBRD countries)EcuadorEgypt, Arab Rep.El SalvadorEquatorial GuineaEritreaEstoniaEthiopiaEuro areaEurope & Central AsiaEurope & Central Asia (excluding high income)Europe & Central Asia (IDA & IBRD countries)European UnionFijiFinlandFragile and conflict affected situationsFranceGabonGambia, TheGeorgiaGermanyGhanaGreeceGrenadaGuatemalaGuineaGuinea-BissauGuyanaHaitiHeavily indebted poor countries (HIPC)High incomeHondurasHong Kong SAR, ChinaHungaryIBRD onlyIcelandIDA & IBRD totalIDA blendIDA onlyIDA totalIndiaIndonesiaIran, Islamic Rep.IraqIrelandIsraelItalyJamaicaJapanJordanKazakhstanKenyaKorea, Dem. People’s Rep.Korea, Rep.KuwaitKyrgyz RepublicLao PDRLate-demographic dividendLatin America & Caribbean Latin America & Caribbean (excluding high income)Latin America & the Caribbean (IDA & IBRD countries)LatviaLeast developed countries: UN classificationLebanonLesothoLiberiaLibyaLiechtensteinLithuaniaLow & middle incomeLow incomeLower middle incomeLuxembourgMacao SAR, ChinaMacedonia, FYRMadagascarMalawiMaldivesMaliMaltaMarshall IslandsMauritaniaMauritiusMexicoMicronesia, Fed. Sts.Middle East & North AfricaMiddle East & North Africa (excluding high income)Middle East & North Africa (IDA & IBRD countries)Middle incomeMoldovaMongoliaMontenegroMoroccoMozambiqueMyanmarNamibiaNepalNetherlandsNew ZealandNicaraguaNigerNigeriaNorth AmericaNorwayOECD membersOmanOther small statesPacific island small statesPakistanPalauPanamaPapua New GuineaParaguayPeruPhilippinesPolandPortugalPost-demographic dividendPre-demographic dividendPuerto RicoQatarRomaniaRussian FederationRwandaSamoaSan MarinoSao Tome and PrincipeSaudi ArabiaSenegalSerbiaSeychellesSierra LeoneSingaporeSlovak RepublicSloveniaSmall statesSomaliaSouth AfricaSouth AsiaSouth Asia (IDA & IBRD)SpainSri LankaSt. Kitts and NevisSt. LuciaSt. Vincent and the GrenadinesSub-Saharan Africa Sub-Saharan Africa (excluding high income)Sub-Saharan Africa (IDA & IBRD countries)SudanSurinameSwazilandSwedenSwitzerlandSyrian Arab RepublicTajikistanTanzaniaThailandTimor-LesteTogoTongaTrinidad and TobagoTunisiaTurkeyTurkmenistanUgandaUkraineUnited Arab EmiratesUnited KingdomUnited StatesUpper middle incomeUruguayUzbekistanVanuatuVenezuela, RBVietnamWest Bank and GazaWorldYemen, Rep.ZambiaZimbabwe Timeline:
This timeline shows a graph from 1972 to 2015 of Belgium. No data until 1971. Number of actual observations by date: 39.
Source name:
World Development Indicators
Source organization:
United Nations Educational, Scientific, and Cultural Organization (UNESCO) Institute for Statistics.
Categories, topics:
Education, Gender
Last updated:
apr 23, 2017
Indicators value changes by year
Minimum:
12.475
jan 1, 1972
Maximum:
83.361
jan 1, 2015
At the date of observation
Value
Absolute change
Change from previous value
jan 1, 1972
12.475
+12.475
0.0%
jan 1, 1973
13.07
+0.595
4.77%
jan 1, 1974
15.421
+2.352
17.99%
jan 1, 1975
16.716
+1.294
8.39%
jan 1, 1976
17.366
+0.651
3.89%
jan 1, 1979
20.72
+3.354
19.31%
jan 1, 1980
21.566
+0.846
4.08%
jan 1, 1981
21.648
+0.081
0.38%
jan 1, 1982
21.995
+0.348
1.61%
jan 1, 1983
23.839
+1.844
8.38%
jan 1, 1984
25.063
+1.224
5.14%
jan 1, 1985
26.371
+1.308
5.22%
jan 1, 1986
28.609
+2.238
8.49%
jan 1, 1987
29.633
+1.024
3.58%
jan 1, 1988
31.838
+2.204
7.44%
jan 1, 1989
33.205
+1.367
4.29%
jan 1, 1990
34.284
+1.079
3.25%
jan 1, 1991
37.63
+3.345
9.76%
jan 1, 1992
39.379
+1.749
4.65%
jan 1, 1994
45.76
+6.381
16.2%
jan 1, 1995
49.227
+3.467
7.58%
jan 1, 1996
54.801
+5.574
11.32%
jan 1, 1997
57.182
+2.38
4.34%
jan 1, 2000
60.547
+3.365
5.89%
jan 1, 2001
60.938
+0.391
0.65%
jan 1, 2002
62.394
+1.456
2.39%
jan 1, 2003
63.648
+1.254
2.01%
jan 1, 2004
64.757
+1.109
1.74%
jan 1, 2005
66.814
+2.057
3.18%
jan 1, 2006
67.743
+0.93
1.39%
jan 1, 2007
68.767
+1.023
1.51%
jan 1, 2008
68.36
-0.407
-0.59%
jan 1, 2009
69.296
+0.936
1.37%
jan 1, 2010
72.445
+3.149
4.54%
jan 1, 2011
75.791
+3.346
4.62%
jan 1, 2012
78.232
+2.441
3.22%
jan 1, 2013
80.352
+2.12
2.71%
jan 1, 2014
81.958
+1.606
2.0%
jan 1, 2015
83.361
+1.403
1.71%
Ranking of countries by current statistics by years


Comments: