29
/
en
AIzaSyAYiBZKx7MnpbEhh9jyipgxe19OcubqV5w
April 1, 2024
27701
East Asia & Pacific
EAS
false
2
1
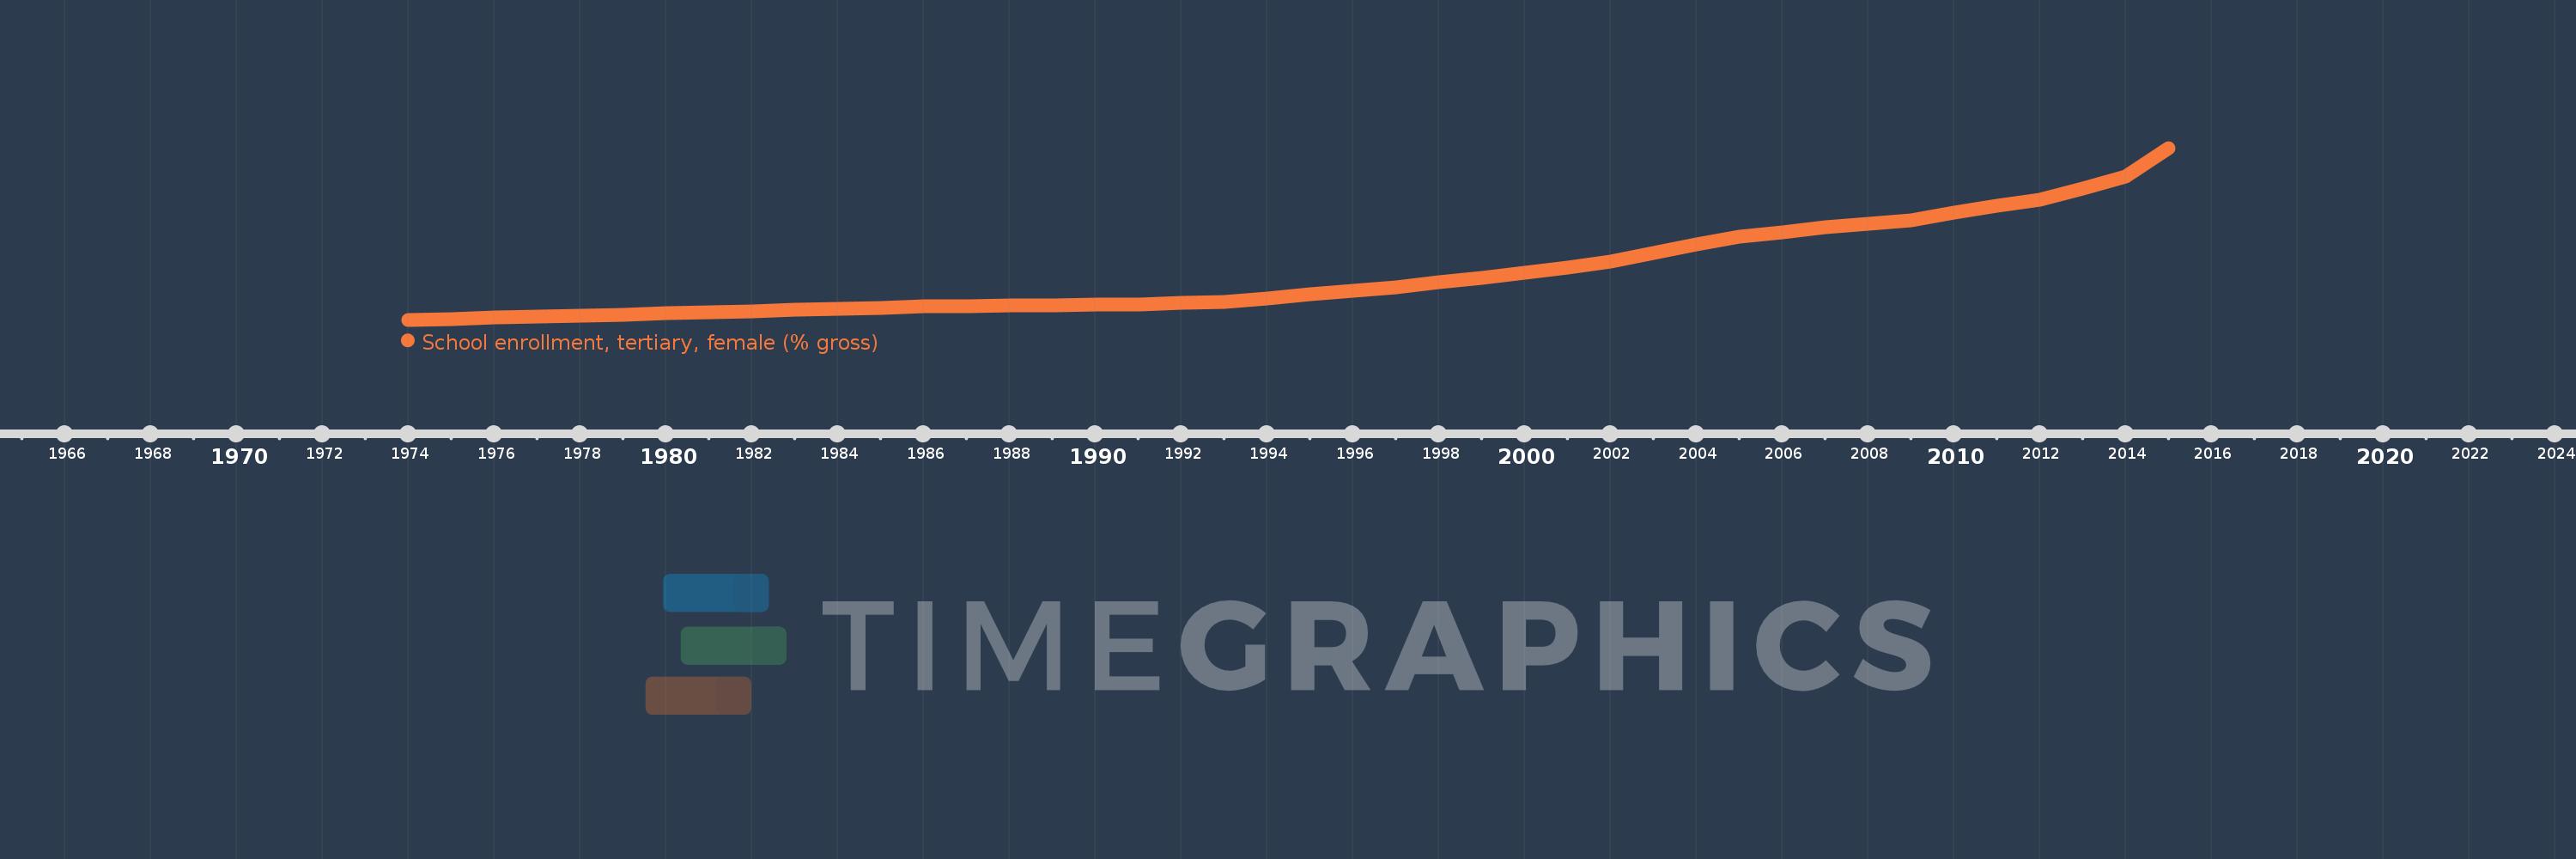
School enrollment, tertiary, female (% gross)
2015,2014,2013,2012,2011,2010,2009,2008,2007,2006,2005,2004,2003,2002,2001,2000,1999,1998,1997,1996,1995,1994,1993,1992,1991,1990,1989,1988,1987,1986,1985,1984,1983,1982,1981,1980,1979,1978,1977,1976,1975,1974
This statistics in other country:
AfghanistanAlbaniaAlgeriaAngolaAntigua and BarbudaArab WorldArgentinaArmeniaArubaAustraliaAustriaAzerbaijanBahamas, TheBahrainBangladeshBarbadosBelarusBelgiumBelizeBeninBermudaBhutanBoliviaBosnia and HerzegovinaBotswanaBrazilBrunei DarussalamBulgariaBurkina FasoBurundiCabo VerdeCambodiaCameroonCanadaCaribbean small statesCentral African RepublicCentral Europe and the BalticsChadChileChinaColombiaComorosCongo, Dem. Rep.Congo, Rep.Costa RicaCote d'IvoireCroatiaCubaCuracaoCyprusCzech RepublicDenmarkDjiboutiDominicaDominican RepublicEarly-demographic dividendEast Asia & PacificEast Asia & Pacific (excluding high income)East Asia & Pacific (IDA & IBRD countries)EcuadorEgypt, Arab Rep.El SalvadorEquatorial GuineaEritreaEstoniaEthiopiaEuro areaEurope & Central AsiaEurope & Central Asia (excluding high income)Europe & Central Asia (IDA & IBRD countries)European UnionFijiFinlandFragile and conflict affected situationsFranceGabonGambia, TheGeorgiaGermanyGhanaGreeceGrenadaGuatemalaGuineaGuinea-BissauGuyanaHaitiHeavily indebted poor countries (HIPC)High incomeHondurasHong Kong SAR, ChinaHungaryIBRD onlyIcelandIDA & IBRD totalIDA blendIDA onlyIDA totalIndiaIndonesiaIran, Islamic Rep.IraqIrelandIsraelItalyJamaicaJapanJordanKazakhstanKenyaKorea, Dem. People’s Rep.Korea, Rep.KuwaitKyrgyz RepublicLao PDRLate-demographic dividendLatin America & Caribbean Latin America & Caribbean (excluding high income)Latin America & the Caribbean (IDA & IBRD countries)LatviaLeast developed countries: UN classificationLebanonLesothoLiberiaLibyaLiechtensteinLithuaniaLow & middle incomeLow incomeLower middle incomeLuxembourgMacao SAR, ChinaMacedonia, FYRMadagascarMalawiMaldivesMaliMaltaMarshall IslandsMauritaniaMauritiusMexicoMicronesia, Fed. Sts.Middle East & North AfricaMiddle East & North Africa (excluding high income)Middle East & North Africa (IDA & IBRD countries)Middle incomeMoldovaMongoliaMontenegroMoroccoMozambiqueMyanmarNamibiaNepalNetherlandsNew ZealandNicaraguaNigerNigeriaNorth AmericaNorwayOECD membersOmanOther small statesPacific island small statesPakistanPalauPanamaPapua New GuineaParaguayPeruPhilippinesPolandPortugalPost-demographic dividendPre-demographic dividendPuerto RicoQatarRomaniaRussian FederationRwandaSamoaSan MarinoSao Tome and PrincipeSaudi ArabiaSenegalSerbiaSeychellesSierra LeoneSingaporeSlovak RepublicSloveniaSmall statesSomaliaSouth AfricaSouth AsiaSouth Asia (IDA & IBRD)SpainSri LankaSt. Kitts and NevisSt. LuciaSt. Vincent and the GrenadinesSub-Saharan Africa Sub-Saharan Africa (excluding high income)Sub-Saharan Africa (IDA & IBRD countries)SudanSurinameSwazilandSwedenSwitzerlandSyrian Arab RepublicTajikistanTanzaniaThailandTimor-LesteTogoTongaTrinidad and TobagoTunisiaTurkeyTurkmenistanUgandaUkraineUnited Arab EmiratesUnited KingdomUnited StatesUpper middle incomeUruguayUzbekistanVanuatuVenezuela, RBVietnamWest Bank and GazaWorldYemen, Rep.ZambiaZimbabwe Timeline:
This timeline shows a graph from 1974 to 2015 of East Asia & Pacific. No data until 1973. Number of actual observations by date: 42.
Source name:
World Development Indicators
Source organization:
United Nations Educational, Scientific, and Cultural Organization (UNESCO) Institute for Statistics.
Categories, topics:
Education, Gender
Last updated:
apr 23, 2017
Indicators value changes by year
Maximum:
41.426
jan 1, 2015
At the date of observation
Value
Absolute change
Change from previous value
jan 1, 1975
2.527
+0.227
9.87%
jan 1, 1976
2.793
+0.266
10.52%
jan 1, 1977
3.019
+0.226
8.09%
jan 1, 1978
3.215
+0.197
6.52%
jan 1, 1979
3.44
+0.225
6.99%
jan 1, 1980
3.728
+0.287
8.35%
jan 1, 1981
3.918
+0.19
5.1%
jan 1, 1982
4.152
+0.234
5.97%
jan 1, 1983
4.567
+0.415
9.99%
jan 1, 1984
4.774
+0.208
4.55%
jan 1, 1985
5.069
+0.295
6.18%
jan 1, 1986
5.286
+0.217
4.28%
jan 1, 1987
5.341
+0.055
1.04%
jan 1, 1988
5.475
+0.134
2.52%
jan 1, 1989
5.495
+0.019
0.35%
jan 1, 1990
5.695
+0.2
3.64%
jan 1, 1991
5.831
+0.136
2.4%
jan 1, 1992
6.105
+0.274
4.7%
jan 1, 1993
6.389
+0.284
4.65%
jan 1, 1994
7.184
+0.795
12.45%
jan 1, 1995
8.052
+0.868
12.08%
jan 1, 1996
8.87
+0.818
10.16%
jan 1, 1997
9.663
+0.792
8.93%
jan 1, 1998
10.84
+1.177
12.18%
jan 1, 1999
11.733
+0.894
8.25%
jan 1, 2000
13.013
+1.279
10.9%
jan 1, 2001
14.16
+1.148
8.82%
jan 1, 2002
15.473
+1.313
9.27%
jan 1, 2003
17.593
+2.119
13.7%
jan 1, 2004
19.383
+1.791
10.18%
jan 1, 2005
21.121
+1.738
8.97%
jan 1, 2006
22.173
+1.052
4.98%
jan 1, 2007
23.305
+1.131
5.1%
jan 1, 2008
24.229
+0.924
3.97%
jan 1, 2009
24.969
+0.741
3.06%
jan 1, 2010
26.641
+1.672
6.69%
jan 1, 2011
28.248
+1.606
6.03%
jan 1, 2012
29.682
+1.434
5.08%
jan 1, 2013
32.224
+2.542
8.57%
jan 1, 2014
34.89
+2.666
8.27%
jan 1, 2015
41.426
+6.536
18.73%
Ranking of countries by current statistics by years


Comments: