29
/
en
AIzaSyAYiBZKx7MnpbEhh9jyipgxe19OcubqV5w
April 1, 2024
36170
High income
HIC
false
2
1
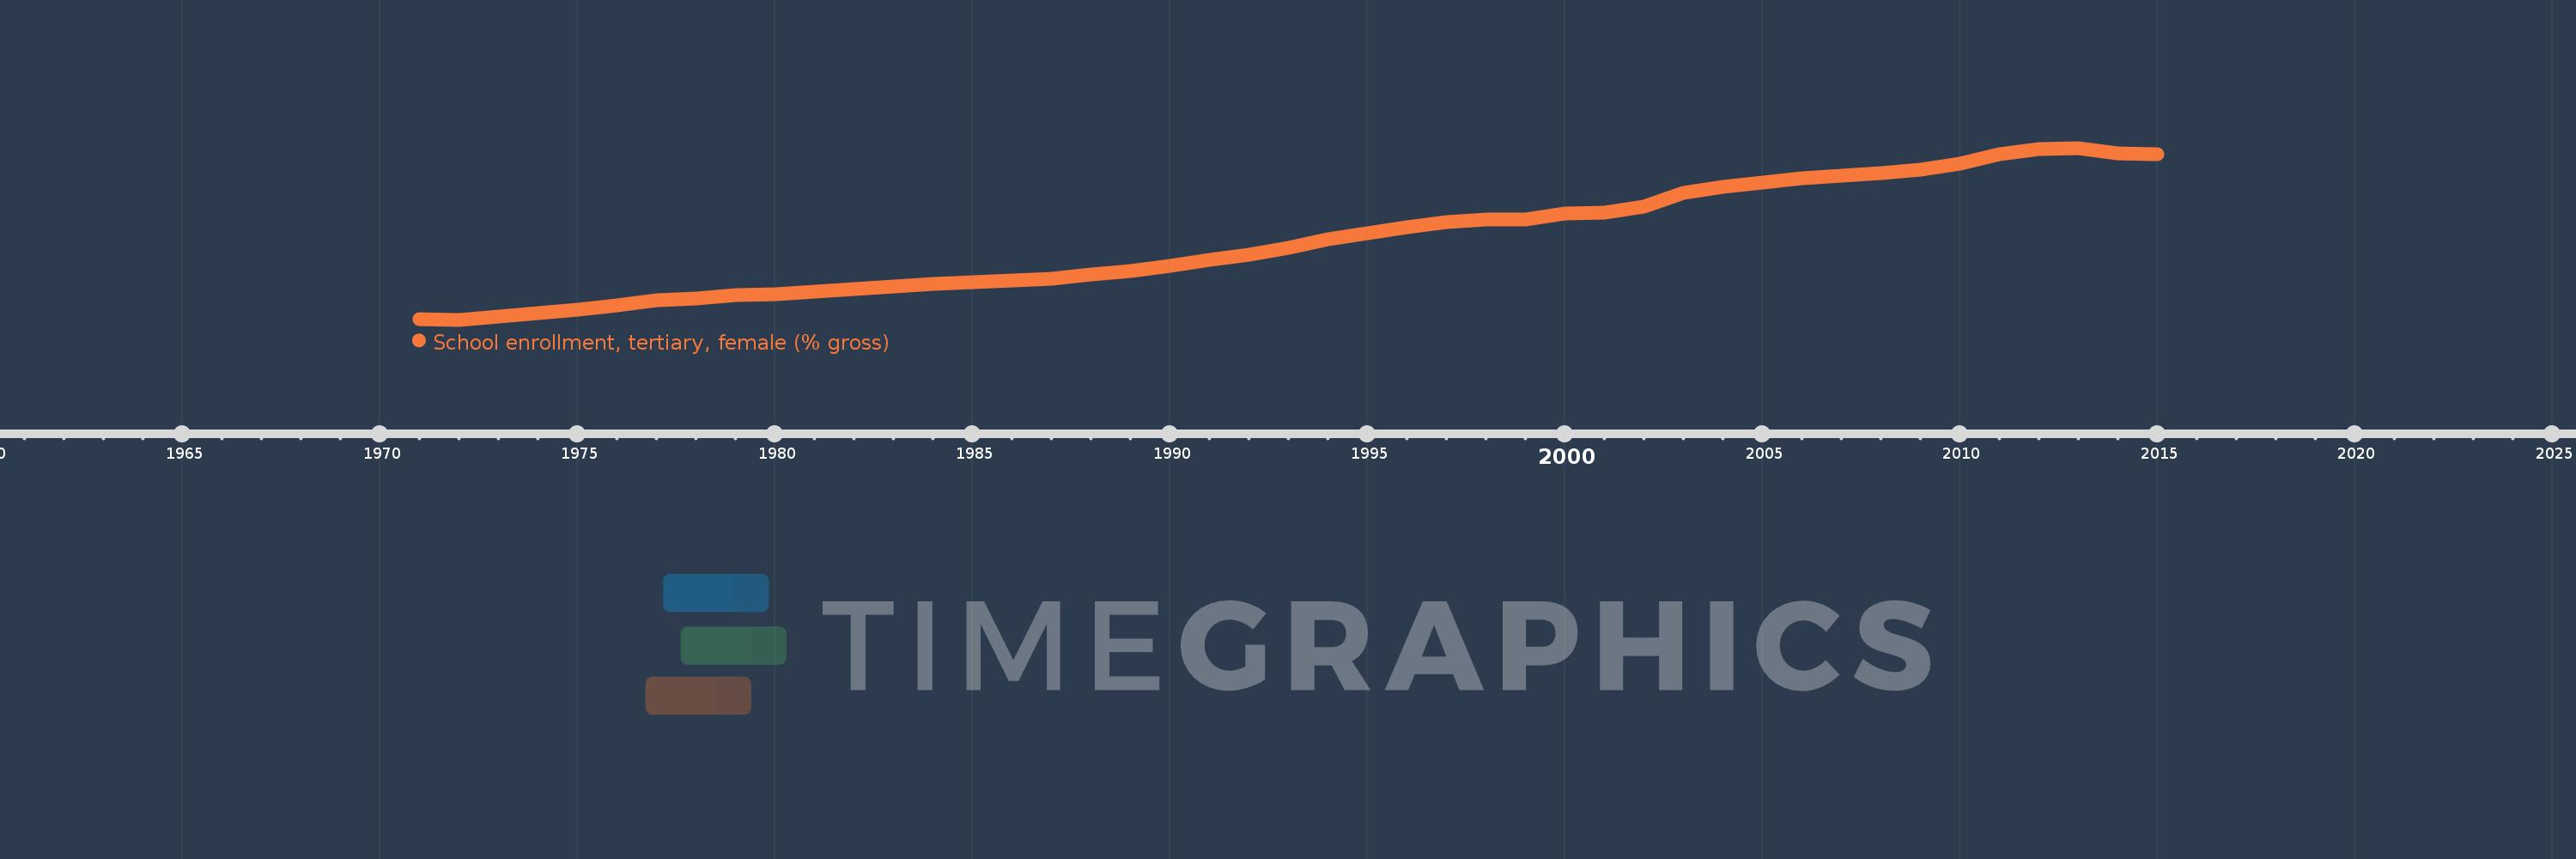
School enrollment, tertiary, female (% gross)
2015,2014,2013,2012,2011,2010,2009,2008,2007,2006,2005,2004,2003,2002,2001,2000,1999,1998,1997,1996,1995,1994,1993,1992,1991,1990,1989,1988,1987,1986,1985,1984,1983,1982,1981,1980,1979,1978,1977,1976,1975,1974,1973,1972,1971
This statistics in other country:
AfghanistanAlbaniaAlgeriaAngolaAntigua and BarbudaArab WorldArgentinaArmeniaArubaAustraliaAustriaAzerbaijanBahamas, TheBahrainBangladeshBarbadosBelarusBelgiumBelizeBeninBermudaBhutanBoliviaBosnia and HerzegovinaBotswanaBrazilBrunei DarussalamBulgariaBurkina FasoBurundiCabo VerdeCambodiaCameroonCanadaCaribbean small statesCentral African RepublicCentral Europe and the BalticsChadChileChinaColombiaComorosCongo, Dem. Rep.Congo, Rep.Costa RicaCote d'IvoireCroatiaCubaCuracaoCyprusCzech RepublicDenmarkDjiboutiDominicaDominican RepublicEarly-demographic dividendEast Asia & PacificEast Asia & Pacific (excluding high income)East Asia & Pacific (IDA & IBRD countries)EcuadorEgypt, Arab Rep.El SalvadorEquatorial GuineaEritreaEstoniaEthiopiaEuro areaEurope & Central AsiaEurope & Central Asia (excluding high income)Europe & Central Asia (IDA & IBRD countries)European UnionFijiFinlandFragile and conflict affected situationsFranceGabonGambia, TheGeorgiaGermanyGhanaGreeceGrenadaGuatemalaGuineaGuinea-BissauGuyanaHaitiHeavily indebted poor countries (HIPC)High incomeHondurasHong Kong SAR, ChinaHungaryIBRD onlyIcelandIDA & IBRD totalIDA blendIDA onlyIDA totalIndiaIndonesiaIran, Islamic Rep.IraqIrelandIsraelItalyJamaicaJapanJordanKazakhstanKenyaKorea, Dem. People’s Rep.Korea, Rep.KuwaitKyrgyz RepublicLao PDRLate-demographic dividendLatin America & Caribbean Latin America & Caribbean (excluding high income)Latin America & the Caribbean (IDA & IBRD countries)LatviaLeast developed countries: UN classificationLebanonLesothoLiberiaLibyaLiechtensteinLithuaniaLow & middle incomeLow incomeLower middle incomeLuxembourgMacao SAR, ChinaMacedonia, FYRMadagascarMalawiMaldivesMaliMaltaMarshall IslandsMauritaniaMauritiusMexicoMicronesia, Fed. Sts.Middle East & North AfricaMiddle East & North Africa (excluding high income)Middle East & North Africa (IDA & IBRD countries)Middle incomeMoldovaMongoliaMontenegroMoroccoMozambiqueMyanmarNamibiaNepalNetherlandsNew ZealandNicaraguaNigerNigeriaNorth AmericaNorwayOECD membersOmanOther small statesPacific island small statesPakistanPalauPanamaPapua New GuineaParaguayPeruPhilippinesPolandPortugalPost-demographic dividendPre-demographic dividendPuerto RicoQatarRomaniaRussian FederationRwandaSamoaSan MarinoSao Tome and PrincipeSaudi ArabiaSenegalSerbiaSeychellesSierra LeoneSingaporeSlovak RepublicSloveniaSmall statesSomaliaSouth AfricaSouth AsiaSouth Asia (IDA & IBRD)SpainSri LankaSt. Kitts and NevisSt. LuciaSt. Vincent and the GrenadinesSub-Saharan Africa Sub-Saharan Africa (excluding high income)Sub-Saharan Africa (IDA & IBRD countries)SudanSurinameSwazilandSwedenSwitzerlandSyrian Arab RepublicTajikistanTanzaniaThailandTimor-LesteTogoTongaTrinidad and TobagoTunisiaTurkeyTurkmenistanUgandaUkraineUnited Arab EmiratesUnited KingdomUnited StatesUpper middle incomeUruguayUzbekistanVanuatuVenezuela, RBVietnamWest Bank and GazaWorldYemen, Rep.ZambiaZimbabwe Timeline:
This timeline shows a graph from 1971 to 2015 of High income. No data until 1970. Number of actual observations by date: 45.
Source name:
World Development Indicators
Source organization:
United Nations Educational, Scientific, and Cultural Organization (UNESCO) Institute for Statistics.
Categories, topics:
Education, Gender
Last updated:
apr 23, 2017
Indicators value changes by year
Minimum:
20.134
jan 1, 1972
Maximum:
83.668
jan 1, 2013
At the date of observation
Value
Absolute change
Change from previous value
jan 1, 1971
20.217
+20.217
0.0%
jan 1, 1972
20.134
-0.083
-0.41%
jan 1, 1973
21.254
+1.12
5.56%
jan 1, 1974
22.709
+1.455
6.85%
jan 1, 1975
23.868
+1.159
5.11%
jan 1, 1976
25.514
+1.646
6.9%
jan 1, 1977
27.285
+1.77
6.94%
jan 1, 1978
28.127
+0.842
3.09%
jan 1, 1979
29.261
+1.134
4.03%
jan 1, 1980
29.59
+0.329
1.13%
jan 1, 1981
30.492
+0.902
3.05%
jan 1, 1982
31.608
+1.116
3.66%
jan 1, 1983
32.442
+0.834
2.64%
jan 1, 1984
33.239
+0.796
2.45%
jan 1, 1985
34.015
+0.777
2.34%
jan 1, 1986
34.618
+0.603
1.77%
jan 1, 1987
35.422
+0.804
2.32%
jan 1, 1988
36.719
+1.297
3.66%
jan 1, 1989
38.282
+1.563
4.26%
jan 1, 1990
39.954
+1.672
4.37%
jan 1, 1991
42.393
+2.439
6.1%
jan 1, 1992
44.077
+1.684
3.97%
jan 1, 1993
46.783
+2.706
6.14%
jan 1, 1994
49.801
+3.017
6.45%
jan 1, 1995
52.272
+2.471
4.96%
jan 1, 1996
54.371
+2.1
4.02%
jan 1, 1997
56.223
+1.852
3.41%
jan 1, 1998
57.292
+1.069
1.9%
jan 1, 1999
57.081
-0.211
-0.37%
jan 1, 2000
59.485
+2.404
4.21%
jan 1, 2001
59.821
+0.336
0.57%
jan 1, 2002
61.813
+1.992
3.33%
jan 1, 2003
67.05
+5.237
8.47%
jan 1, 2004
69.395
+2.345
3.5%
jan 1, 2005
71.021
+1.626
2.34%
jan 1, 2006
72.436
+1.415
1.99%
jan 1, 2007
73.334
+0.898
1.24%
jan 1, 2008
74.271
+0.937
1.28%
jan 1, 2009
75.654
+1.383
1.86%
jan 1, 2010
77.916
+2.262
2.99%
jan 1, 2011
81.372
+3.456
4.44%
jan 1, 2012
83.316
+1.944
2.39%
jan 1, 2013
83.668
+0.352
0.42%
jan 1, 2014
81.664
-2.004
-2.39%
jan 1, 2015
81.379
-0.285
-0.35%
Ranking of countries by current statistics by years


Comments: