29
/
en
AIzaSyAYiBZKx7MnpbEhh9jyipgxe19OcubqV5w
April 1, 2024
161955
Italy
ITA
true
2
1
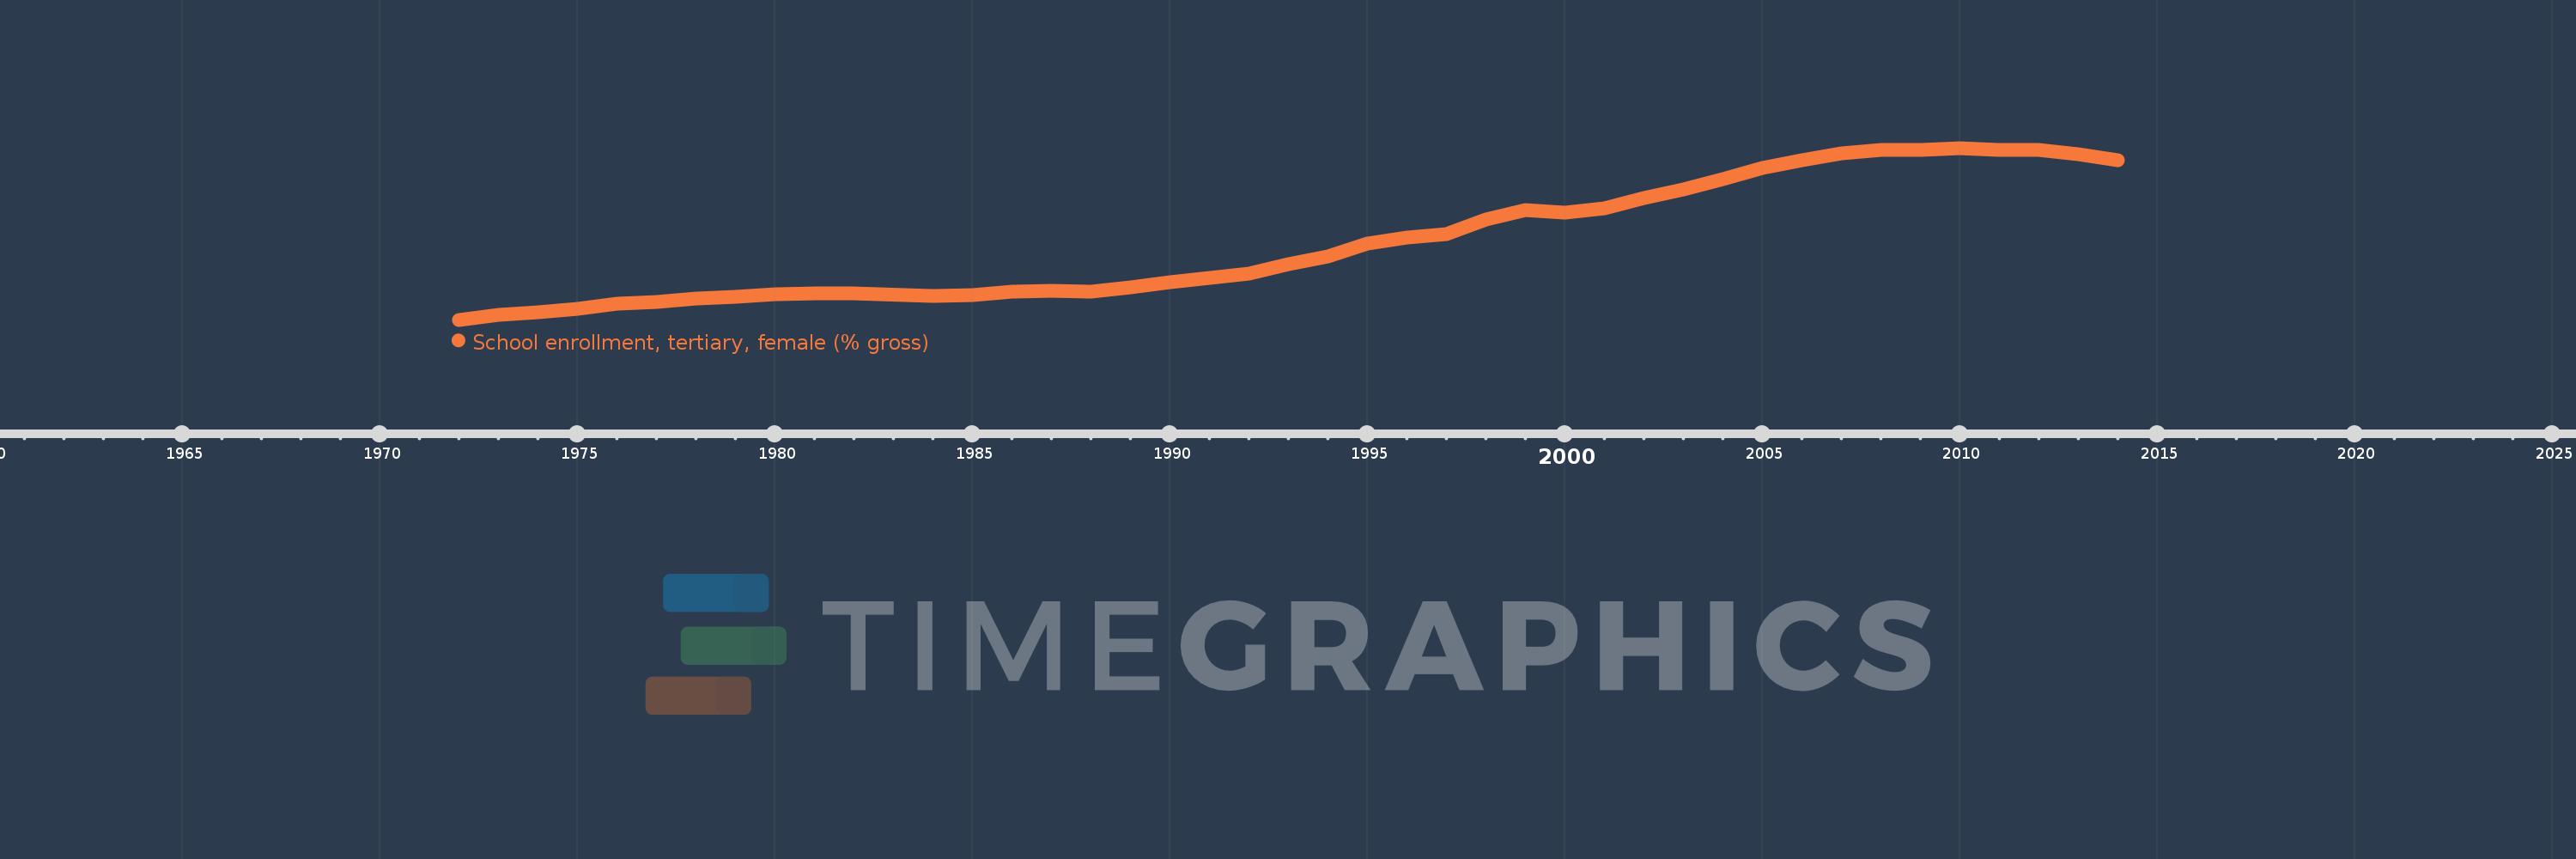
School enrollment, tertiary, female (% gross)
2014,2013,2012,2011,2010,2009,2008,2007,2006,2005,2004,2003,2002,2001,2000,1999,1998,1997,1996,1995,1994,1993,1992,1991,1990,1989,1988,1987,1986,1985,1984,1982,1981,1980,1979,1978,1977,1976,1975,1974,1973,1972
This statistics in other country:
AfghanistanAlbaniaAlgeriaAngolaAntigua and BarbudaArab WorldArgentinaArmeniaArubaAustraliaAustriaAzerbaijanBahamas, TheBahrainBangladeshBarbadosBelarusBelgiumBelizeBeninBermudaBhutanBoliviaBosnia and HerzegovinaBotswanaBrazilBrunei DarussalamBulgariaBurkina FasoBurundiCabo VerdeCambodiaCameroonCanadaCaribbean small statesCentral African RepublicCentral Europe and the BalticsChadChileChinaColombiaComorosCongo, Dem. Rep.Congo, Rep.Costa RicaCote d'IvoireCroatiaCubaCuracaoCyprusCzech RepublicDenmarkDjiboutiDominicaDominican RepublicEarly-demographic dividendEast Asia & PacificEast Asia & Pacific (excluding high income)East Asia & Pacific (IDA & IBRD countries)EcuadorEgypt, Arab Rep.El SalvadorEquatorial GuineaEritreaEstoniaEthiopiaEuro areaEurope & Central AsiaEurope & Central Asia (excluding high income)Europe & Central Asia (IDA & IBRD countries)European UnionFijiFinlandFragile and conflict affected situationsFranceGabonGambia, TheGeorgiaGermanyGhanaGreeceGrenadaGuatemalaGuineaGuinea-BissauGuyanaHaitiHeavily indebted poor countries (HIPC)High incomeHondurasHong Kong SAR, ChinaHungaryIBRD onlyIcelandIDA & IBRD totalIDA blendIDA onlyIDA totalIndiaIndonesiaIran, Islamic Rep.IraqIrelandIsraelItalyJamaicaJapanJordanKazakhstanKenyaKorea, Dem. People’s Rep.Korea, Rep.KuwaitKyrgyz RepublicLao PDRLate-demographic dividendLatin America & Caribbean Latin America & Caribbean (excluding high income)Latin America & the Caribbean (IDA & IBRD countries)LatviaLeast developed countries: UN classificationLebanonLesothoLiberiaLibyaLiechtensteinLithuaniaLow & middle incomeLow incomeLower middle incomeLuxembourgMacao SAR, ChinaMacedonia, FYRMadagascarMalawiMaldivesMaliMaltaMarshall IslandsMauritaniaMauritiusMexicoMicronesia, Fed. Sts.Middle East & North AfricaMiddle East & North Africa (excluding high income)Middle East & North Africa (IDA & IBRD countries)Middle incomeMoldovaMongoliaMontenegroMoroccoMozambiqueMyanmarNamibiaNepalNetherlandsNew ZealandNicaraguaNigerNigeriaNorth AmericaNorwayOECD membersOmanOther small statesPacific island small statesPakistanPalauPanamaPapua New GuineaParaguayPeruPhilippinesPolandPortugalPost-demographic dividendPre-demographic dividendPuerto RicoQatarRomaniaRussian FederationRwandaSamoaSan MarinoSao Tome and PrincipeSaudi ArabiaSenegalSerbiaSeychellesSierra LeoneSingaporeSlovak RepublicSloveniaSmall statesSomaliaSouth AfricaSouth AsiaSouth Asia (IDA & IBRD)SpainSri LankaSt. Kitts and NevisSt. LuciaSt. Vincent and the GrenadinesSub-Saharan Africa Sub-Saharan Africa (excluding high income)Sub-Saharan Africa (IDA & IBRD countries)SudanSurinameSwazilandSwedenSwitzerlandSyrian Arab RepublicTajikistanTanzaniaThailandTimor-LesteTogoTongaTrinidad and TobagoTunisiaTurkeyTurkmenistanUgandaUkraineUnited Arab EmiratesUnited KingdomUnited StatesUpper middle incomeUruguayUzbekistanVanuatuVenezuela, RBVietnamWest Bank and GazaWorldYemen, Rep.ZambiaZimbabwe Timeline:
This timeline shows a graph from 1972 to 2014 of Italy. No data until 1971. Number of actual observations by date: 42.
Source name:
World Development Indicators
Source organization:
United Nations Educational, Scientific, and Cultural Organization (UNESCO) Institute for Statistics.
Categories, topics:
Education, Gender
Last updated:
apr 23, 2017
Indicators value changes by year
Minimum:
12.853
jan 1, 1972
At the date of observation
Value
Absolute change
Change from previous value
jan 1, 1972
12.853
+12.853
0.0%
jan 1, 1973
14.65
+1.797
13.98%
jan 1, 1974
15.774
+1.124
7.67%
jan 1, 1975
17.201
+1.427
9.04%
jan 1, 1976
19.012
+1.811
10.53%
jan 1, 1977
19.851
+0.839
4.41%
jan 1, 1978
20.926
+1.075
5.42%
jan 1, 1979
21.843
+0.917
4.38%
jan 1, 1980
22.675
+0.832
3.81%
jan 1, 1981
22.971
+0.296
1.3%
jan 1, 1982
23.06
+0.088
0.39%
jan 1, 1984
22.107
-0.953
-4.13%
jan 1, 1985
22.458
+0.351
1.59%
jan 1, 1986
23.711
+1.253
5.58%
jan 1, 1987
23.981
+0.27
1.14%
jan 1, 1988
23.604
-0.377
-1.57%
jan 1, 1989
25.425
+1.821
7.71%
jan 1, 1990
27.242
+1.817
7.15%
jan 1, 1991
28.952
+1.71
6.28%
jan 1, 1992
30.751
+1.799
6.21%
jan 1, 1993
34.106
+3.356
10.91%
jan 1, 1994
37.069
+2.963
8.69%
jan 1, 1995
42.05
+4.981
13.44%
jan 1, 1996
44.344
+2.294
5.46%
jan 1, 1997
45.644
+1.299
2.93%
jan 1, 1998
51.451
+5.808
12.72%
jan 1, 1999
55.214
+3.763
7.31%
jan 1, 2000
54.19
-1.024
-1.85%
jan 1, 2001
55.818
+1.628
3.0%
jan 1, 2002
59.723
+3.905
7.0%
jan 1, 2003
63.124
+3.4
5.69%
jan 1, 2004
66.889
+3.765
5.96%
jan 1, 2005
71.154
+4.266
6.38%
jan 1, 2006
74.327
+3.172
4.46%
jan 1, 2007
76.863
+2.536
3.41%
jan 1, 2008
78.161
+1.298
1.69%
jan 1, 2009
78.202
+0.04
0.05%
jan 1, 2010
78.96
+0.758
0.97%
jan 1, 2011
78.147
-0.813
-1.03%
jan 1, 2012
78.184
+0.037
0.05%
jan 1, 2013
76.637
-1.547
-1.98%
jan 1, 2014
74.225
-2.412
-3.15%
Ranking of countries by current statistics by years


Comments: