29
/
en
AIzaSyAYiBZKx7MnpbEhh9jyipgxe19OcubqV5w
April 1, 2024
33047
Europe & Central Asia (IDA & IBRD countries)
TEC
false
2
1
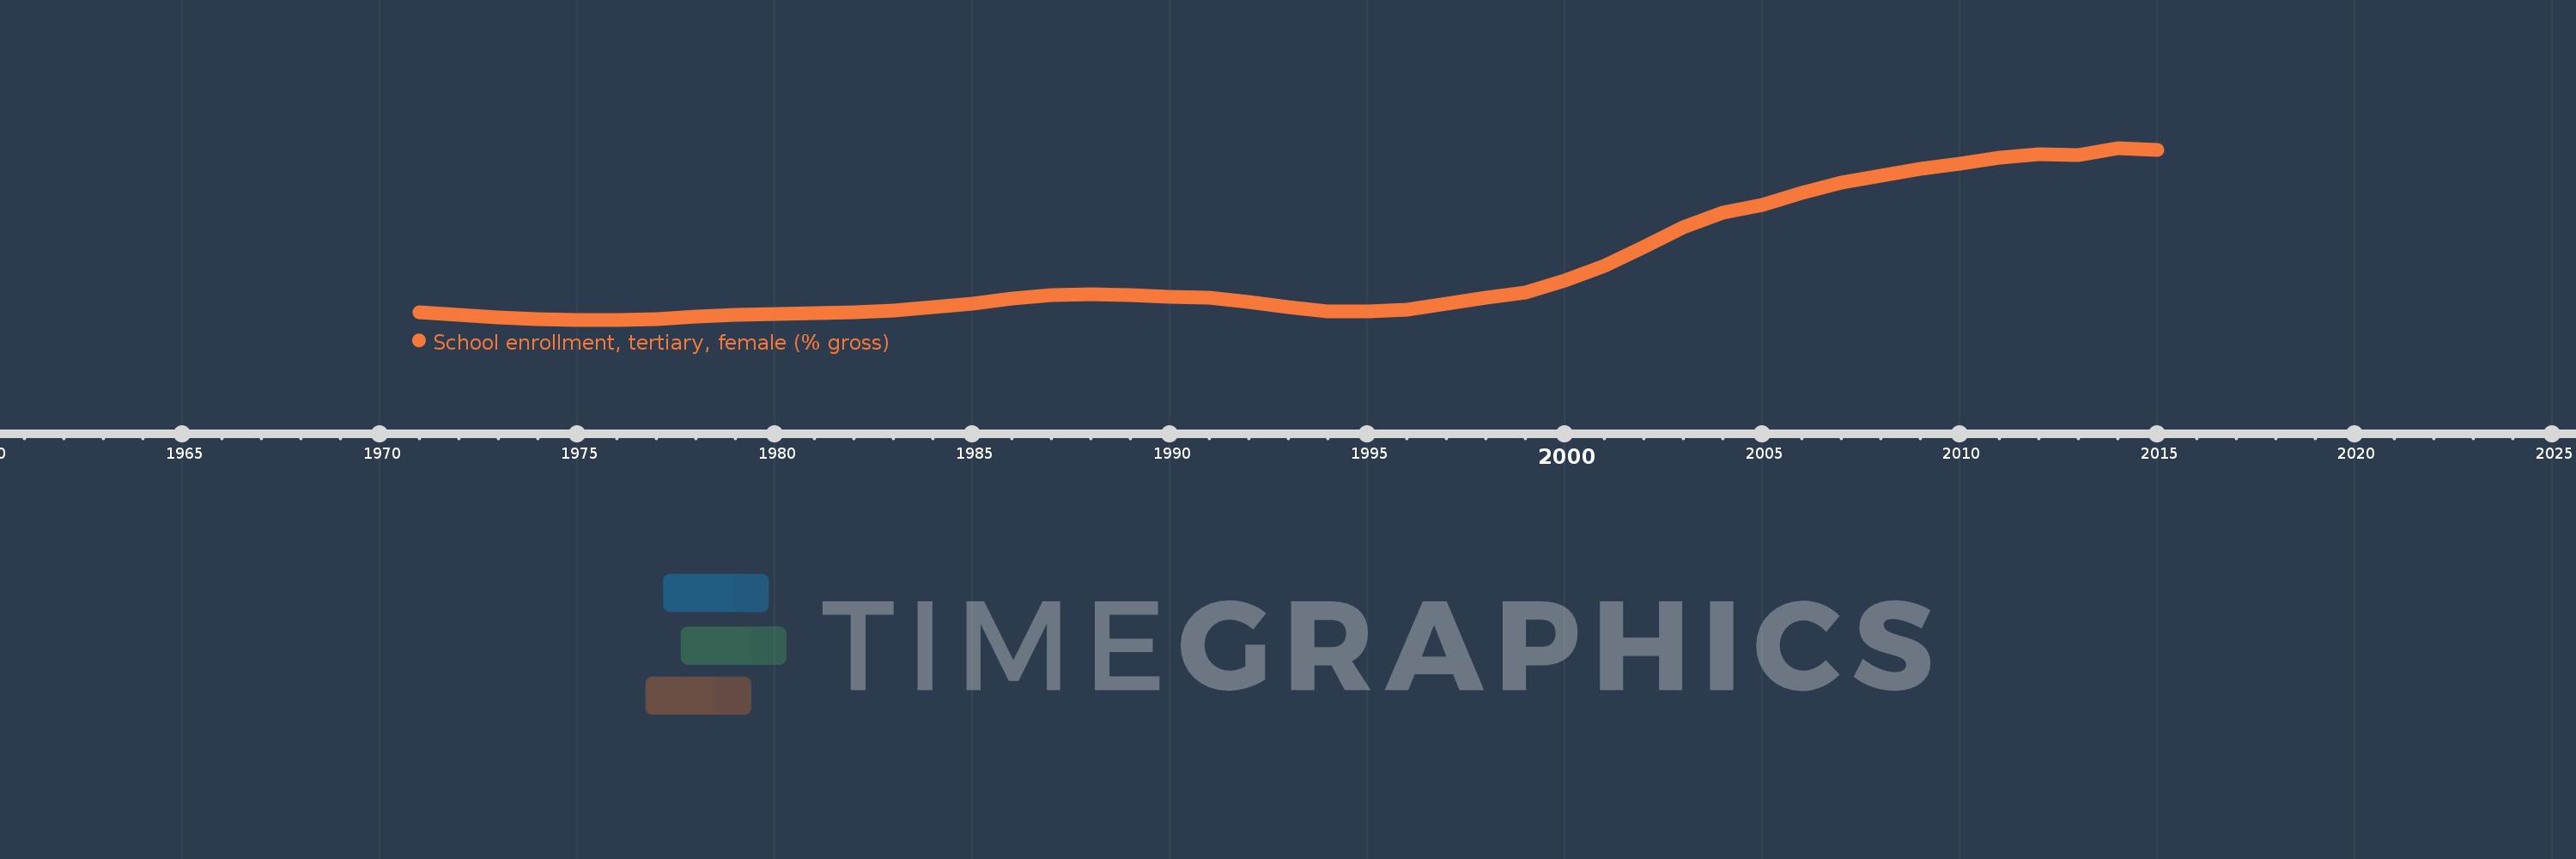
School enrollment, tertiary, female (% gross)
2015,2014,2013,2012,2011,2010,2009,2008,2007,2006,2005,2004,2003,2002,2001,2000,1999,1998,1997,1996,1995,1994,1993,1992,1991,1990,1989,1988,1987,1986,1985,1984,1983,1982,1981,1980,1979,1978,1977,1976,1975,1974,1973,1972,1971
This statistics in other country:
AfghanistanAlbaniaAlgeriaAngolaAntigua and BarbudaArab WorldArgentinaArmeniaArubaAustraliaAustriaAzerbaijanBahamas, TheBahrainBangladeshBarbadosBelarusBelgiumBelizeBeninBermudaBhutanBoliviaBosnia and HerzegovinaBotswanaBrazilBrunei DarussalamBulgariaBurkina FasoBurundiCabo VerdeCambodiaCameroonCanadaCaribbean small statesCentral African RepublicCentral Europe and the BalticsChadChileChinaColombiaComorosCongo, Dem. Rep.Congo, Rep.Costa RicaCote d'IvoireCroatiaCubaCuracaoCyprusCzech RepublicDenmarkDjiboutiDominicaDominican RepublicEarly-demographic dividendEast Asia & PacificEast Asia & Pacific (excluding high income)East Asia & Pacific (IDA & IBRD countries)EcuadorEgypt, Arab Rep.El SalvadorEquatorial GuineaEritreaEstoniaEthiopiaEuro areaEurope & Central AsiaEurope & Central Asia (excluding high income)Europe & Central Asia (IDA & IBRD countries)European UnionFijiFinlandFragile and conflict affected situationsFranceGabonGambia, TheGeorgiaGermanyGhanaGreeceGrenadaGuatemalaGuineaGuinea-BissauGuyanaHaitiHeavily indebted poor countries (HIPC)High incomeHondurasHong Kong SAR, ChinaHungaryIBRD onlyIcelandIDA & IBRD totalIDA blendIDA onlyIDA totalIndiaIndonesiaIran, Islamic Rep.IraqIrelandIsraelItalyJamaicaJapanJordanKazakhstanKenyaKorea, Dem. People’s Rep.Korea, Rep.KuwaitKyrgyz RepublicLao PDRLate-demographic dividendLatin America & Caribbean Latin America & Caribbean (excluding high income)Latin America & the Caribbean (IDA & IBRD countries)LatviaLeast developed countries: UN classificationLebanonLesothoLiberiaLibyaLiechtensteinLithuaniaLow & middle incomeLow incomeLower middle incomeLuxembourgMacao SAR, ChinaMacedonia, FYRMadagascarMalawiMaldivesMaliMaltaMarshall IslandsMauritaniaMauritiusMexicoMicronesia, Fed. Sts.Middle East & North AfricaMiddle East & North Africa (excluding high income)Middle East & North Africa (IDA & IBRD countries)Middle incomeMoldovaMongoliaMontenegroMoroccoMozambiqueMyanmarNamibiaNepalNetherlandsNew ZealandNicaraguaNigerNigeriaNorth AmericaNorwayOECD membersOmanOther small statesPacific island small statesPakistanPalauPanamaPapua New GuineaParaguayPeruPhilippinesPolandPortugalPost-demographic dividendPre-demographic dividendPuerto RicoQatarRomaniaRussian FederationRwandaSamoaSan MarinoSao Tome and PrincipeSaudi ArabiaSenegalSerbiaSeychellesSierra LeoneSingaporeSlovak RepublicSloveniaSmall statesSomaliaSouth AfricaSouth AsiaSouth Asia (IDA & IBRD)SpainSri LankaSt. Kitts and NevisSt. LuciaSt. Vincent and the GrenadinesSub-Saharan Africa Sub-Saharan Africa (excluding high income)Sub-Saharan Africa (IDA & IBRD countries)SudanSurinameSwazilandSwedenSwitzerlandSyrian Arab RepublicTajikistanTanzaniaThailandTimor-LesteTogoTongaTrinidad and TobagoTunisiaTurkeyTurkmenistanUgandaUkraineUnited Arab EmiratesUnited KingdomUnited StatesUpper middle incomeUruguayUzbekistanVanuatuVenezuela, RBVietnamWest Bank and GazaWorldYemen, Rep.ZambiaZimbabwe Timeline:
This timeline shows a graph from 1971 to 2015 of Europe & Central Asia (IDA & IBRD countries). No data until 1970. Number of actual observations by date: 45.
Source name:
World Development Indicators
Source organization:
United Nations Educational, Scientific, and Cultural Organization (UNESCO) Institute for Statistics.
Categories, topics:
Education, Gender
Last updated:
apr 23, 2017
Indicators value changes by year
Minimum:
31.639
jan 1, 1976
Maximum:
66.865
jan 1, 2014
At the date of observation
Value
Absolute change
Change from previous value
jan 1, 1971
33.154
+33.154
0.0%
jan 1, 1972
32.719
-0.434
-1.31%
jan 1, 1973
32.147
-0.572
-1.75%
jan 1, 1974
31.806
-0.341
-1.06%
jan 1, 1975
31.658
-0.148
-0.47%
jan 1, 1976
31.639
-0.019
-0.06%
jan 1, 1977
31.774
+0.136
0.43%
jan 1, 1978
32.237
+0.463
1.46%
jan 1, 1979
32.6
+0.363
1.13%
jan 1, 1980
32.752
+0.152
0.47%
jan 1, 1981
32.932
+0.18
0.55%
jan 1, 1982
33.245
+0.313
0.95%
jan 1, 1983
33.591
+0.346
1.04%
jan 1, 1984
34.161
+0.569
1.7%
jan 1, 1985
35.015
+0.854
2.5%
jan 1, 1986
35.954
+0.939
2.68%
jan 1, 1987
36.636
+0.683
1.9%
jan 1, 1988
36.833
+0.197
0.54%
jan 1, 1989
36.635
-0.199
-0.54%
jan 1, 1990
36.293
-0.341
-0.93%
jan 1, 1991
36.117
-0.176
-0.49%
jan 1, 1992
35.224
-0.893
-2.47%
jan 1, 1993
34.237
-0.987
-2.8%
jan 1, 1994
33.324
-0.913
-2.67%
jan 1, 1995
33.379
+0.056
0.17%
jan 1, 1996
33.655
+0.275
0.82%
jan 1, 1997
34.904
+1.25
3.71%
jan 1, 1998
36.207
+1.303
3.73%
jan 1, 1999
37.258
+1.051
2.9%
jan 1, 2000
39.675
+2.417
6.49%
jan 1, 2001
42.637
+2.961
7.46%
jan 1, 2002
46.587
+3.95
9.26%
jan 1, 2003
50.575
+3.988
8.56%
jan 1, 2004
53.555
+2.98
5.89%
jan 1, 2005
55.258
+1.702
3.18%
jan 1, 2006
57.707
+2.449
4.43%
jan 1, 2007
59.756
+2.049
3.55%
jan 1, 2008
61.225
+1.469
2.46%
jan 1, 2009
62.589
+1.364
2.23%
jan 1, 2010
63.653
+1.064
1.7%
jan 1, 2011
64.94
+1.287
2.02%
jan 1, 2012
65.517
+0.577
0.89%
jan 1, 2013
65.449
-0.069
-0.1%
jan 1, 2014
66.865
+1.417
2.16%
jan 1, 2015
66.501
-0.364
-0.54%
Ranking of countries by current statistics by years


Comments: