29
/
en
AIzaSyAYiBZKx7MnpbEhh9jyipgxe19OcubqV5w
April 1, 2024
82836
Belize
BLZ
true
2
1
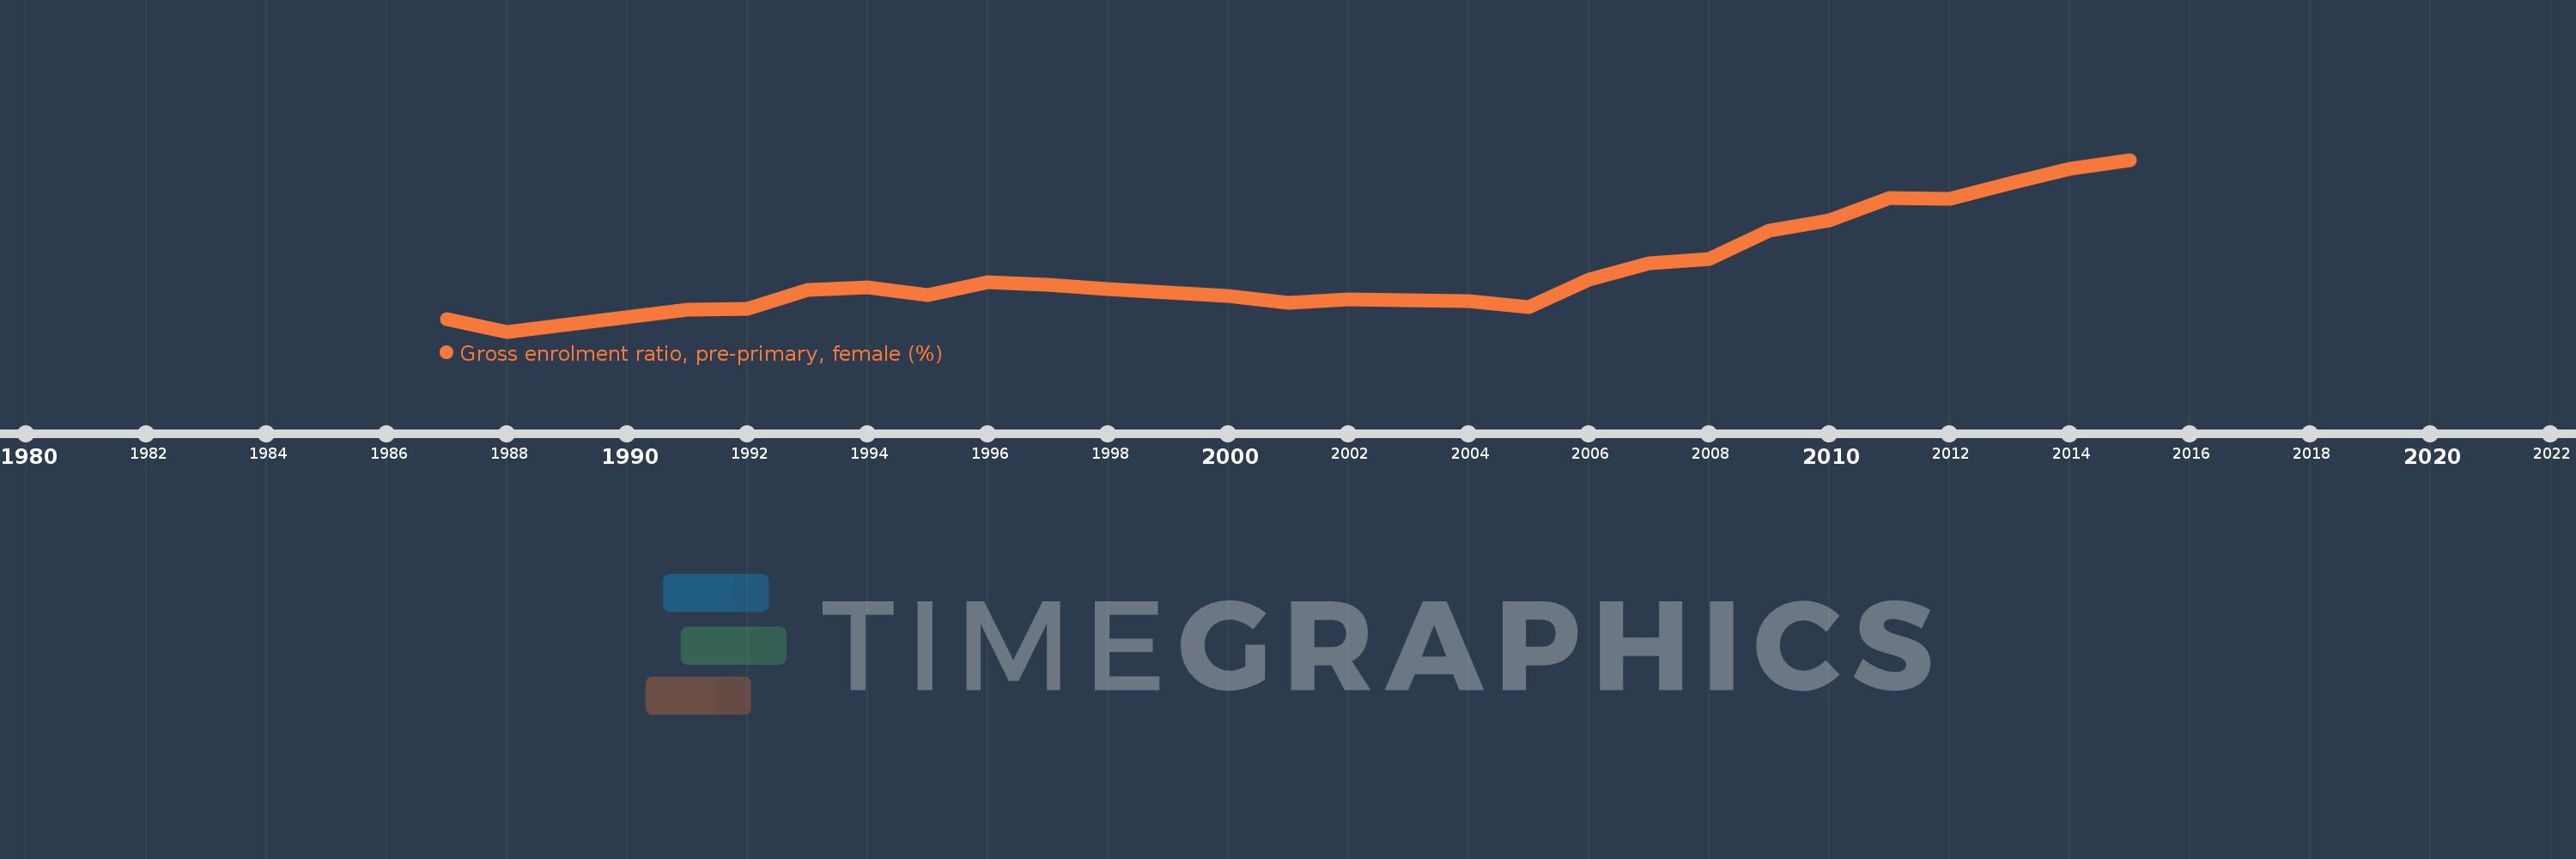
Gross enrolment ratio, pre-primary, female (%)
2015,2014,2013,2012,2011,2010,2009,2008,2007,2006,2005,2004,2002,2001,2000,1998,1997,1996,1995,1994,1993,1992,1991,1988,1987
This statistics in other country:
AfghanistanAlbaniaAlgeriaAndorraAngolaAntigua and BarbudaArab WorldArgentinaArmeniaArubaAustraliaAustriaAzerbaijanBahamas, TheBahrainBangladeshBarbadosBelarusBelgiumBelizeBeninBermudaBhutanBoliviaBosnia and HerzegovinaBotswanaBrazilBrunei DarussalamBulgariaBurkina FasoBurundiCabo VerdeCambodiaCameroonCanadaCaribbean small statesCentral African RepublicCentral Europe and the BalticsChadChileChinaColombiaComorosCongo, Dem. Rep.Congo, Rep.Costa RicaCote d'IvoireCroatiaCubaCyprusCzech RepublicDenmarkDjiboutiDominicaDominican RepublicEarly-demographic dividendEast Asia & PacificEast Asia & Pacific (excluding high income)East Asia & Pacific (IDA & IBRD countries)EcuadorEgypt, Arab Rep.El SalvadorEquatorial GuineaEritreaEstoniaEthiopiaEuro areaEurope & Central AsiaEurope & Central Asia (excluding high income)Europe & Central Asia (IDA & IBRD countries)European UnionFijiFinlandFragile and conflict affected situationsFranceGabonGambia, TheGeorgiaGermanyGhanaGreeceGrenadaGuatemalaGuineaGuinea-BissauGuyanaHeavily indebted poor countries (HIPC)High incomeHondurasHong Kong SAR, ChinaHungaryIBRD onlyIcelandIDA & IBRD totalIDA blendIDA onlyIDA totalIndiaIndonesiaIran, Islamic Rep.IraqIrelandIsraelItalyJamaicaJapanJordanKazakhstanKenyaKorea, Dem. People’s Rep.Korea, Rep.KuwaitKyrgyz RepublicLao PDRLate-demographic dividendLatin America & Caribbean Latin America & Caribbean (excluding high income)Latin America & the Caribbean (IDA & IBRD countries)LatviaLeast developed countries: UN classificationLebanonLesothoLiberiaLibyaLiechtensteinLithuaniaLow & middle incomeLow incomeLower middle incomeLuxembourgMacao SAR, ChinaMacedonia, FYRMadagascarMaldivesMaliMaltaMarshall IslandsMauritaniaMauritiusMexicoMicronesia, Fed. Sts.Middle East & North AfricaMiddle East & North Africa (excluding high income)Middle East & North Africa (IDA & IBRD countries)Middle incomeMoldovaMongoliaMontenegroMoroccoMozambiqueMyanmarNamibiaNauruNepalNetherlandsNew ZealandNicaraguaNigerNigeriaNorth AmericaNorwayOECD membersOmanOther small statesPacific island small statesPakistanPalauPanamaPapua New GuineaParaguayPeruPhilippinesPolandPortugalPost-demographic dividendPre-demographic dividendPuerto RicoQatarRomaniaRussian FederationRwandaSamoaSan MarinoSao Tome and PrincipeSaudi ArabiaSenegalSerbiaSeychellesSierra LeoneSlovak RepublicSloveniaSmall statesSolomon IslandsSomaliaSouth AfricaSouth AsiaSouth Asia (IDA & IBRD)South SudanSpainSri LankaSt. Kitts and NevisSt. LuciaSt. Vincent and the GrenadinesSub-Saharan Africa Sub-Saharan Africa (excluding high income)Sub-Saharan Africa (IDA & IBRD countries)SudanSurinameSwazilandSwedenSwitzerlandSyrian Arab RepublicTajikistanTanzaniaThailandTimor-LesteTogoTongaTrinidad and TobagoTunisiaTurkeyTurkmenistanTuvaluUgandaUkraineUnited Arab EmiratesUnited KingdomUnited StatesUpper middle incomeUruguayUzbekistanVanuatuVenezuela, RBVietnamWest Bank and GazaWorldYemen, Rep.Zimbabwe Timeline:
This timeline shows a graph from 1987 to 2015 of Belize. No data until 1986. Number of actual observations by date: 25.
Source name:
World Development Indicators
Source organization:
UNESCO Institute for Statistics
Categories, topics:
Education, Gender
Last updated:
apr 23, 2017
Indicators value changes by year
Maximum:
50.829
jan 1, 2015
At the date of observation
Value
Absolute change
Change from previous value
jan 1, 1987
22.435
+22.435
0.0%
jan 1, 1988
20.28
-2.155
-9.6%
jan 1, 1991
24.216
+3.935
19.41%
jan 1, 1992
24.383
+0.168
0.69%
jan 1, 1993
27.741
+3.358
13.77%
jan 1, 1994
28.148
+0.406
1.47%
jan 1, 1995
26.742
-1.406
-4.99%
jan 1, 1996
29.118
+2.376
8.89%
jan 1, 1997
28.591
-0.528
-1.81%
jan 1, 1998
27.794
-0.797
-2.79%
jan 1, 2000
26.69
-1.104
-3.97%
jan 1, 2001
25.359
-1.332
-4.99%
jan 1, 2002
25.953
+0.595
2.35%
jan 1, 2004
25.652
-0.301
-1.16%
jan 1, 2005
24.559
-1.093
-4.26%
jan 1, 2006
29.594
+5.035
20.5%
jan 1, 2007
32.402
+2.808
9.49%
jan 1, 2008
33.112
+0.71
2.19%
jan 1, 2009
38.221
+5.109
15.43%
jan 1, 2010
40.005
+1.784
4.67%
jan 1, 2011
44.054
+4.049
10.12%
jan 1, 2012
43.816
-0.238
-0.54%
jan 1, 2013
46.615
+2.799
6.39%
jan 1, 2014
49.202
+2.586
5.55%
jan 1, 2015
50.829
+1.627
3.31%
Ranking of countries by current statistics by years


Comments: