29
/
en
AIzaSyAYiBZKx7MnpbEhh9jyipgxe19OcubqV5w
April 1, 2024
238312
Seychelles
SYC
true
2
1
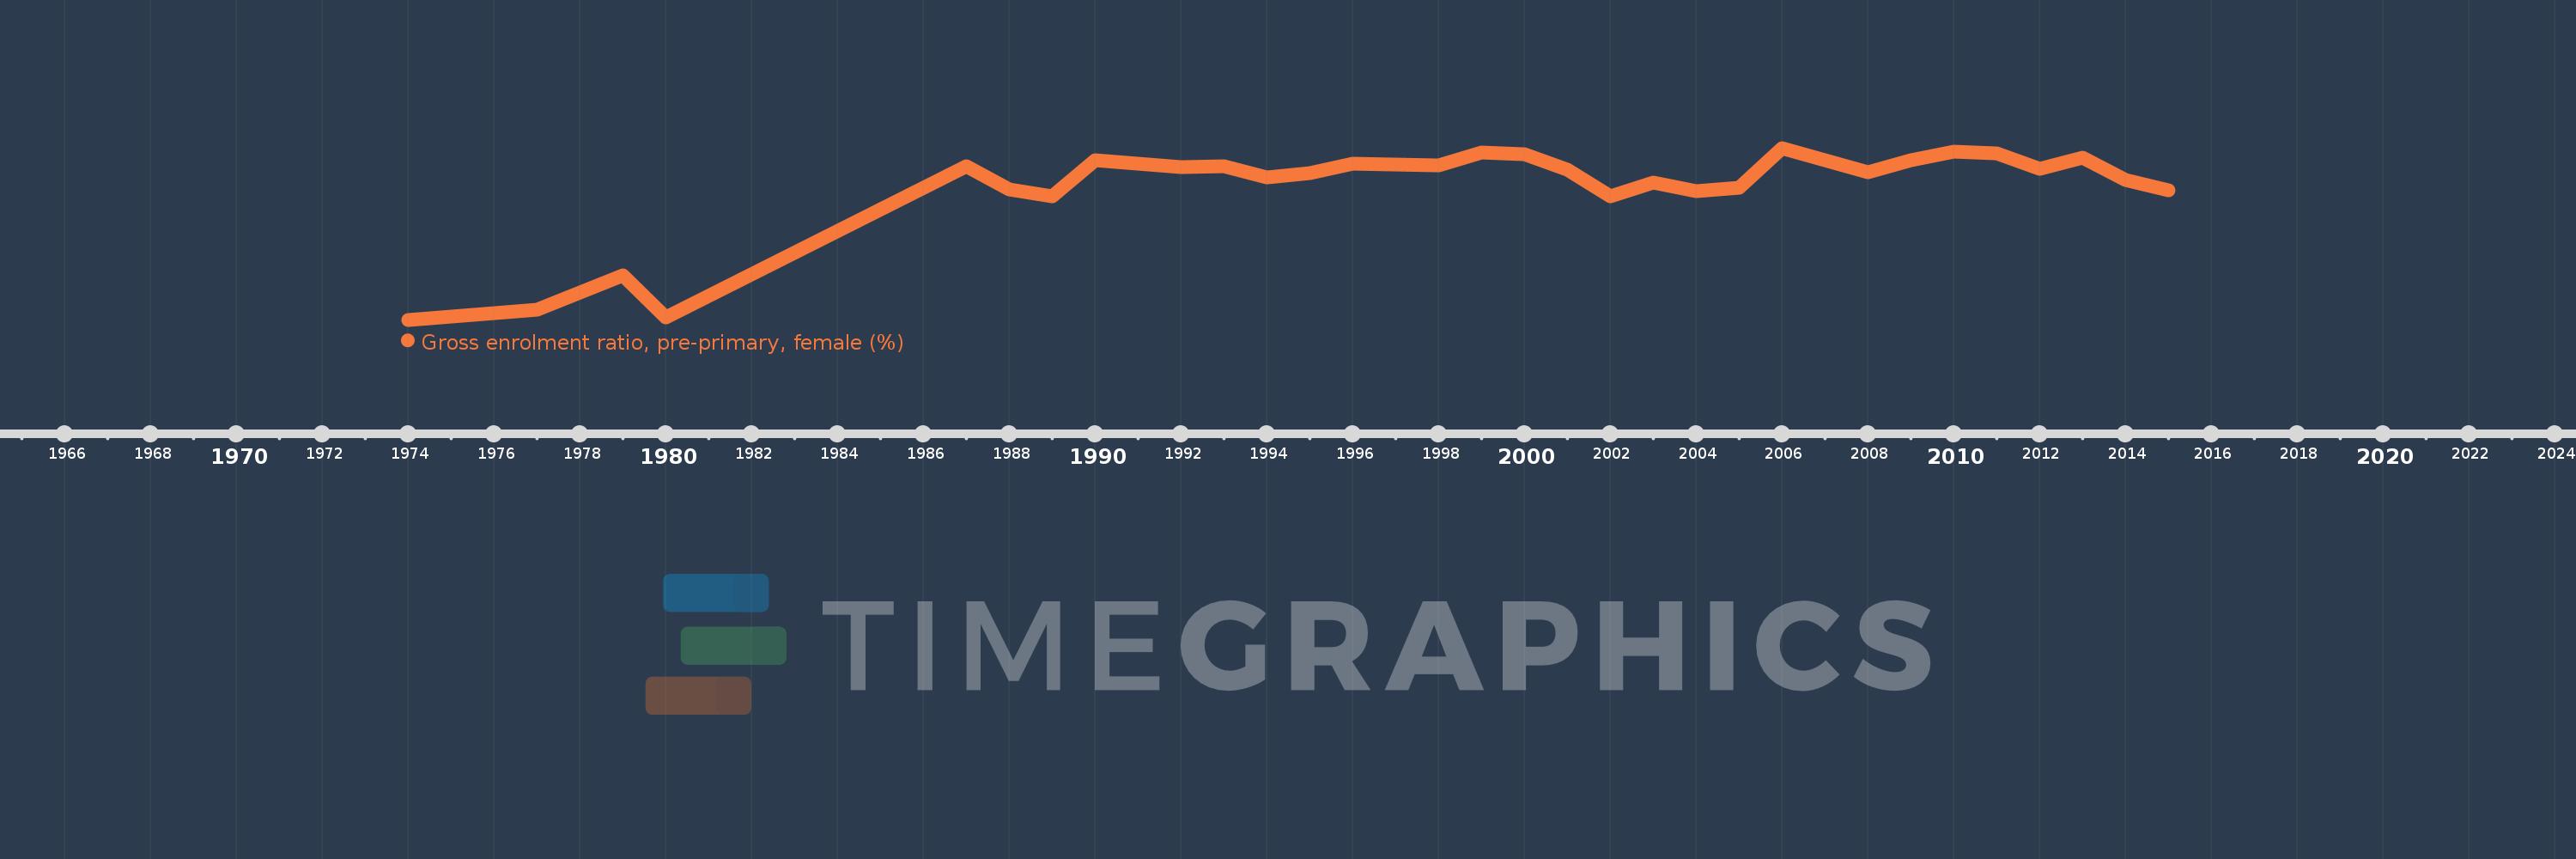
Gross enrolment ratio, pre-primary, female (%)
2015,2014,2013,2012,2011,2010,2009,2008,2006,2005,2004,2003,2002,2001,2000,1999,1998,1997,1996,1995,1994,1993,1992,1991,1990,1989,1988,1987,1980,1979,1977,1975,1974
This statistics in other country:
AfghanistanAlbaniaAlgeriaAndorraAngolaAntigua and BarbudaArab WorldArgentinaArmeniaArubaAustraliaAustriaAzerbaijanBahamas, TheBahrainBangladeshBarbadosBelarusBelgiumBelizeBeninBermudaBhutanBoliviaBosnia and HerzegovinaBotswanaBrazilBrunei DarussalamBulgariaBurkina FasoBurundiCabo VerdeCambodiaCameroonCanadaCaribbean small statesCentral African RepublicCentral Europe and the BalticsChadChileChinaColombiaComorosCongo, Dem. Rep.Congo, Rep.Costa RicaCote d'IvoireCroatiaCubaCyprusCzech RepublicDenmarkDjiboutiDominicaDominican RepublicEarly-demographic dividendEast Asia & PacificEast Asia & Pacific (excluding high income)East Asia & Pacific (IDA & IBRD countries)EcuadorEgypt, Arab Rep.El SalvadorEquatorial GuineaEritreaEstoniaEthiopiaEuro areaEurope & Central AsiaEurope & Central Asia (excluding high income)Europe & Central Asia (IDA & IBRD countries)European UnionFijiFinlandFragile and conflict affected situationsFranceGabonGambia, TheGeorgiaGermanyGhanaGreeceGrenadaGuatemalaGuineaGuinea-BissauGuyanaHeavily indebted poor countries (HIPC)High incomeHondurasHong Kong SAR, ChinaHungaryIBRD onlyIcelandIDA & IBRD totalIDA blendIDA onlyIDA totalIndiaIndonesiaIran, Islamic Rep.IraqIrelandIsraelItalyJamaicaJapanJordanKazakhstanKenyaKorea, Dem. People’s Rep.Korea, Rep.KuwaitKyrgyz RepublicLao PDRLate-demographic dividendLatin America & Caribbean Latin America & Caribbean (excluding high income)Latin America & the Caribbean (IDA & IBRD countries)LatviaLeast developed countries: UN classificationLebanonLesothoLiberiaLibyaLiechtensteinLithuaniaLow & middle incomeLow incomeLower middle incomeLuxembourgMacao SAR, ChinaMacedonia, FYRMadagascarMaldivesMaliMaltaMarshall IslandsMauritaniaMauritiusMexicoMicronesia, Fed. Sts.Middle East & North AfricaMiddle East & North Africa (excluding high income)Middle East & North Africa (IDA & IBRD countries)Middle incomeMoldovaMongoliaMontenegroMoroccoMozambiqueMyanmarNamibiaNauruNepalNetherlandsNew ZealandNicaraguaNigerNigeriaNorth AmericaNorwayOECD membersOmanOther small statesPacific island small statesPakistanPalauPanamaPapua New GuineaParaguayPeruPhilippinesPolandPortugalPost-demographic dividendPre-demographic dividendPuerto RicoQatarRomaniaRussian FederationRwandaSamoaSan MarinoSao Tome and PrincipeSaudi ArabiaSenegalSerbiaSeychellesSierra LeoneSlovak RepublicSloveniaSmall statesSolomon IslandsSomaliaSouth AfricaSouth AsiaSouth Asia (IDA & IBRD)South SudanSpainSri LankaSt. Kitts and NevisSt. LuciaSt. Vincent and the GrenadinesSub-Saharan Africa Sub-Saharan Africa (excluding high income)Sub-Saharan Africa (IDA & IBRD countries)SudanSurinameSwazilandSwedenSwitzerlandSyrian Arab RepublicTajikistanTanzaniaThailandTimor-LesteTogoTongaTrinidad and TobagoTunisiaTurkeyTurkmenistanTuvaluUgandaUkraineUnited Arab EmiratesUnited KingdomUnited StatesUpper middle incomeUruguayUzbekistanVanuatuVenezuela, RBVietnamWest Bank and GazaWorldYemen, Rep.Zimbabwe Timeline:
This timeline shows a graph from 1974 to 2015 of Seychelles. No data until 1973. Number of actual observations by date: 33.
Source name:
World Development Indicators
Source organization:
UNESCO Institute for Statistics
Categories, topics:
Education, Gender
Last updated:
apr 23, 2017
Indicators value changes by year
Minimum:
53.594
jan 1, 1974
Maximum:
105.99
jan 1, 2006
At the date of observation
Value
Absolute change
Change from previous value
jan 1, 1974
53.594
+53.594
0.0%
jan 1, 1975
54.609
+1.015
1.89%
jan 1, 1977
56.706
+2.098
3.84%
jan 1, 1979
67.253
+10.547
18.6%
jan 1, 1980
54.315
-12.938
-19.24%
jan 1, 1987
100.491
+46.176
85.02%
jan 1, 1988
93.241
-7.25
-7.21%
jan 1, 1989
91.11
-2.131
-2.29%
jan 1, 1990
102.198
+11.089
12.17%
jan 1, 1991
101.198
-1.001
-0.98%
jan 1, 1992
100.246
-0.952
-0.94%
jan 1, 1993
100.376
+0.13
0.13%
jan 1, 1994
97.016
-3.36
-3.35%
jan 1, 1995
98.211
+1.195
1.23%
jan 1, 1996
101.277
+3.066
3.12%
jan 1, 1997
100.963
-0.314
-0.31%
jan 1, 1998
100.775
-0.188
-0.19%
jan 1, 1999
104.631
+3.856
3.83%
jan 1, 2000
104.032
-0.6
-0.57%
jan 1, 2001
99.329
-4.703
-4.52%
jan 1, 2002
91.304
-8.025
-8.08%
jan 1, 2003
95.532
+4.228
4.63%
jan 1, 2004
92.888
-2.644
-2.77%
jan 1, 2005
93.824
+0.935
1.01%
jan 1, 2006
105.99
+12.166
12.97%
jan 1, 2008
98.634
-7.356
-6.94%
jan 1, 2009
102.297
+3.663
3.71%
jan 1, 2010
104.834
+2.537
2.48%
jan 1, 2011
104.341
-0.493
-0.47%
jan 1, 2012
99.575
-4.767
-4.57%
jan 1, 2013
102.983
+3.408
3.42%
jan 1, 2014
96.296
-6.687
-6.49%
jan 1, 2015
93.01
-3.286
-3.41%
Ranking of countries by current statistics by years


Comments: