29
/
en
AIzaSyAYiBZKx7MnpbEhh9jyipgxe19OcubqV5w
April 1, 2024
134162
France
FRA
true
2
1
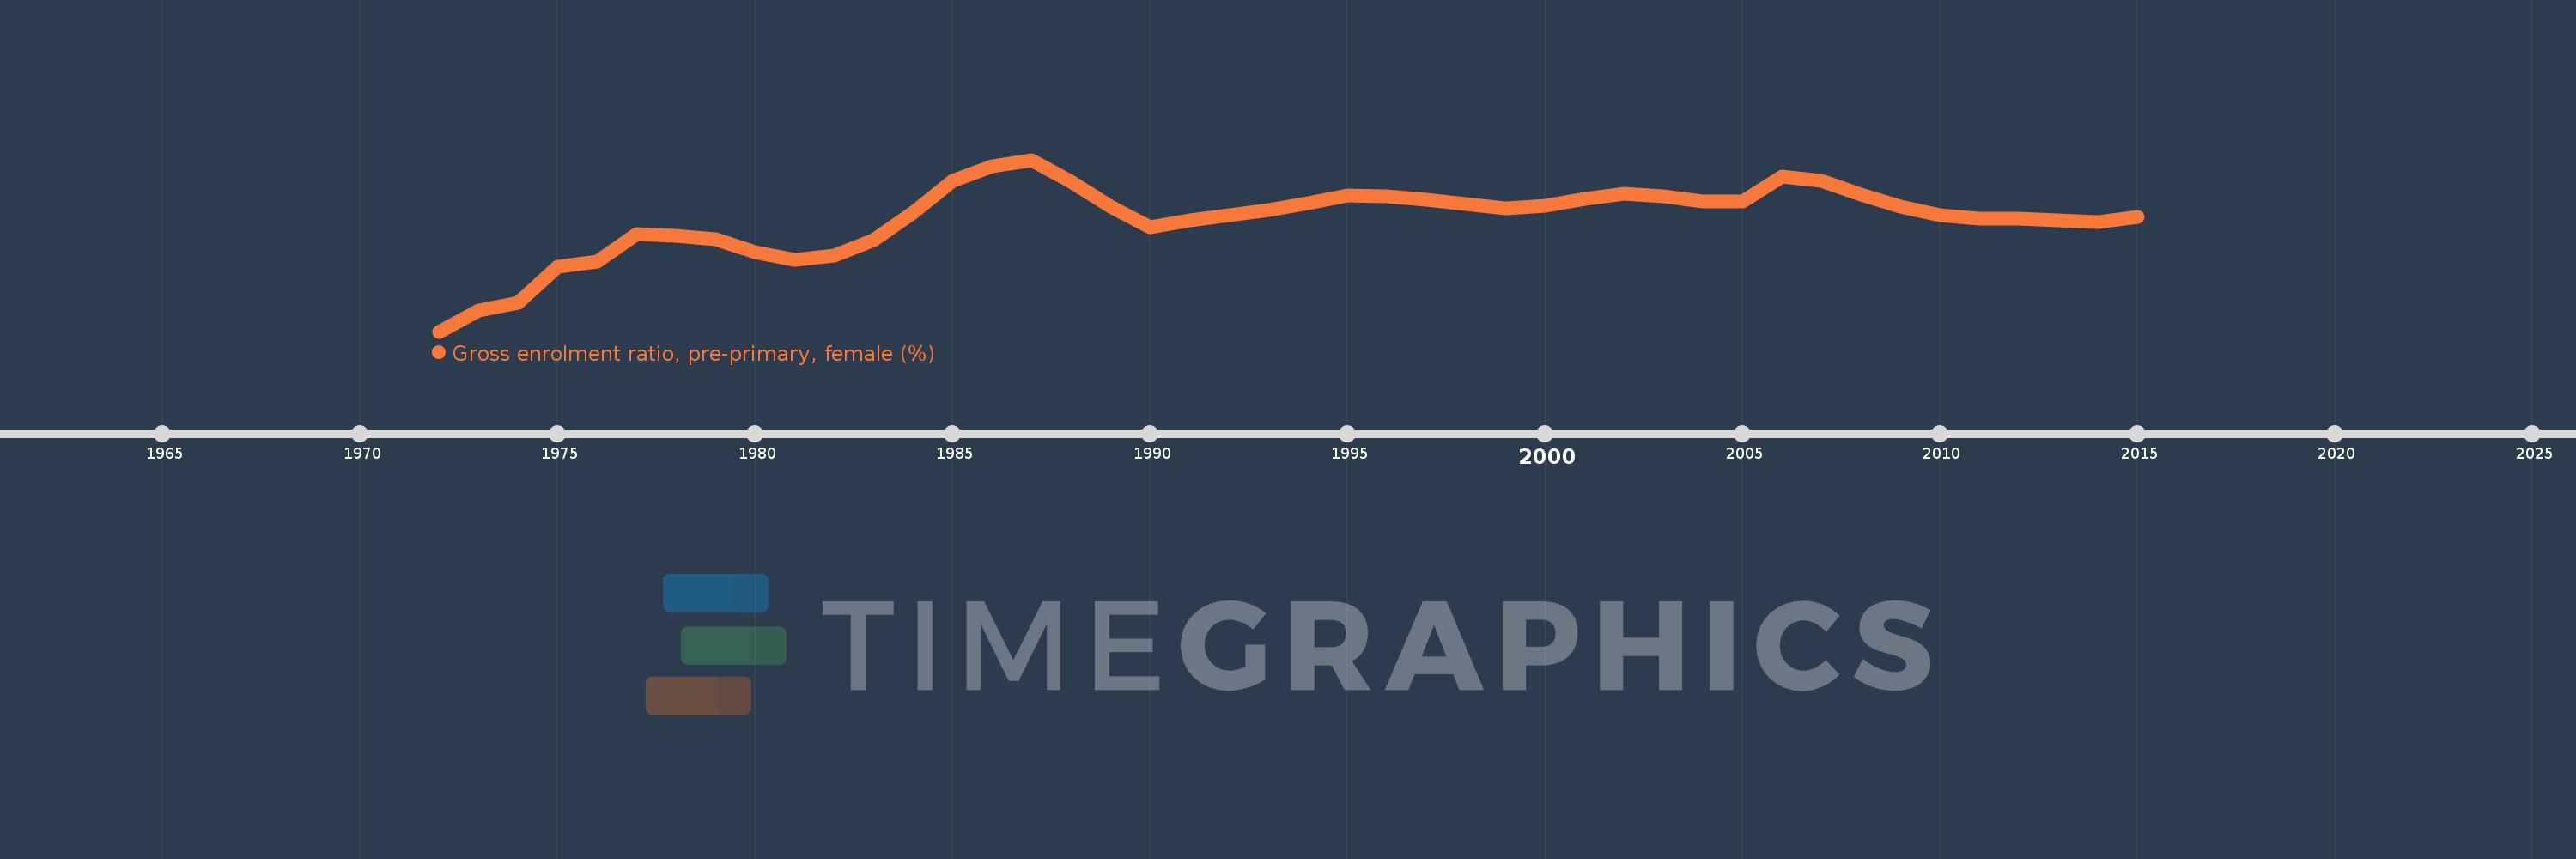
Gross enrolment ratio, pre-primary, female (%)
2015,2014,2013,2012,2011,2010,2009,2008,2007,2006,2005,2004,2003,2002,2001,2000,1999,1998,1997,1996,1995,1994,1993,1992,1991,1990,1989,1988,1987,1986,1985,1984,1983,1982,1981,1980,1979,1978,1977,1976,1975,1974,1973,1972
This statistics in other country:
AfghanistanAlbaniaAlgeriaAndorraAngolaAntigua and BarbudaArab WorldArgentinaArmeniaArubaAustraliaAustriaAzerbaijanBahamas, TheBahrainBangladeshBarbadosBelarusBelgiumBelizeBeninBermudaBhutanBoliviaBosnia and HerzegovinaBotswanaBrazilBrunei DarussalamBulgariaBurkina FasoBurundiCabo VerdeCambodiaCameroonCanadaCaribbean small statesCentral African RepublicCentral Europe and the BalticsChadChileChinaColombiaComorosCongo, Dem. Rep.Congo, Rep.Costa RicaCote d'IvoireCroatiaCubaCyprusCzech RepublicDenmarkDjiboutiDominicaDominican RepublicEarly-demographic dividendEast Asia & PacificEast Asia & Pacific (excluding high income)East Asia & Pacific (IDA & IBRD countries)EcuadorEgypt, Arab Rep.El SalvadorEquatorial GuineaEritreaEstoniaEthiopiaEuro areaEurope & Central AsiaEurope & Central Asia (excluding high income)Europe & Central Asia (IDA & IBRD countries)European UnionFijiFinlandFragile and conflict affected situationsFranceGabonGambia, TheGeorgiaGermanyGhanaGreeceGrenadaGuatemalaGuineaGuinea-BissauGuyanaHeavily indebted poor countries (HIPC)High incomeHondurasHong Kong SAR, ChinaHungaryIBRD onlyIcelandIDA & IBRD totalIDA blendIDA onlyIDA totalIndiaIndonesiaIran, Islamic Rep.IraqIrelandIsraelItalyJamaicaJapanJordanKazakhstanKenyaKorea, Dem. People’s Rep.Korea, Rep.KuwaitKyrgyz RepublicLao PDRLate-demographic dividendLatin America & Caribbean Latin America & Caribbean (excluding high income)Latin America & the Caribbean (IDA & IBRD countries)LatviaLeast developed countries: UN classificationLebanonLesothoLiberiaLibyaLiechtensteinLithuaniaLow & middle incomeLow incomeLower middle incomeLuxembourgMacao SAR, ChinaMacedonia, FYRMadagascarMaldivesMaliMaltaMarshall IslandsMauritaniaMauritiusMexicoMicronesia, Fed. Sts.Middle East & North AfricaMiddle East & North Africa (excluding high income)Middle East & North Africa (IDA & IBRD countries)Middle incomeMoldovaMongoliaMontenegroMoroccoMozambiqueMyanmarNamibiaNauruNepalNetherlandsNew ZealandNicaraguaNigerNigeriaNorth AmericaNorwayOECD membersOmanOther small statesPacific island small statesPakistanPalauPanamaPapua New GuineaParaguayPeruPhilippinesPolandPortugalPost-demographic dividendPre-demographic dividendPuerto RicoQatarRomaniaRussian FederationRwandaSamoaSan MarinoSao Tome and PrincipeSaudi ArabiaSenegalSerbiaSeychellesSierra LeoneSlovak RepublicSloveniaSmall statesSolomon IslandsSomaliaSouth AfricaSouth AsiaSouth Asia (IDA & IBRD)South SudanSpainSri LankaSt. Kitts and NevisSt. LuciaSt. Vincent and the GrenadinesSub-Saharan Africa Sub-Saharan Africa (excluding high income)Sub-Saharan Africa (IDA & IBRD countries)SudanSurinameSwazilandSwedenSwitzerlandSyrian Arab RepublicTajikistanTanzaniaThailandTimor-LesteTogoTongaTrinidad and TobagoTunisiaTurkeyTurkmenistanTuvaluUgandaUkraineUnited Arab EmiratesUnited KingdomUnited StatesUpper middle incomeUruguayUzbekistanVanuatuVenezuela, RBVietnamWest Bank and GazaWorldYemen, Rep.Zimbabwe Timeline:
This timeline shows a graph from 1972 to 2015 of France. No data until 1971. Number of actual observations by date: 44.
Source name:
World Development Indicators
Source organization:
UNESCO Institute for Statistics
Categories, topics:
Education, Gender
Last updated:
apr 23, 2017
Indicators value changes by year
Minimum:
86.523
jan 1, 1972
Maximum:
119.84
jan 1, 1987
At the date of observation
Value
Absolute change
Change from previous value
jan 1, 1972
86.523
+86.523
0.0%
jan 1, 1973
90.677
+4.154
4.8%
jan 1, 1974
92.081
+1.404
1.55%
jan 1, 1975
99.173
+7.092
7.7%
jan 1, 1976
100.074
+0.9
0.91%
jan 1, 1977
105.479
+5.405
5.4%
jan 1, 1978
105.047
-0.432
-0.41%
jan 1, 1979
104.463
-0.584
-0.56%
jan 1, 1980
101.894
-2.569
-2.46%
jan 1, 1981
100.412
-1.482
-1.45%
jan 1, 1982
101.272
+0.86
0.86%
jan 1, 1983
104.205
+2.933
2.9%
jan 1, 1984
109.545
+5.339
5.12%
jan 1, 1985
115.775
+6.231
5.69%
jan 1, 1986
118.661
+2.885
2.49%
jan 1, 1987
119.84
+1.18
0.99%
jan 1, 1988
115.651
-4.189
-3.5%
jan 1, 1989
110.739
-4.913
-4.25%
jan 1, 1990
106.709
-4.03
-3.64%
jan 1, 1991
108.1
+1.391
1.3%
jan 1, 1992
109.029
+0.929
0.86%
jan 1, 1993
110.17
+1.142
1.05%
jan 1, 1994
111.362
+1.191
1.08%
jan 1, 1995
112.951
+1.589
1.43%
jan 1, 1996
112.738
-0.213
-0.19%
jan 1, 1997
112.169
-0.569
-0.5%
jan 1, 1998
111.223
-0.946
-0.84%
jan 1, 1999
110.35
-0.872
-0.78%
jan 1, 2000
110.969
+0.619
0.56%
jan 1, 2001
112.191
+1.222
1.1%
jan 1, 2002
113.195
+1.004
0.89%
jan 1, 2003
112.779
-0.417
-0.37%
jan 1, 2004
111.708
-1.071
-0.95%
jan 1, 2005
111.748
+0.039
0.04%
jan 1, 2006
116.527
+4.78
4.28%
jan 1, 2007
115.799
-0.729
-0.63%
jan 1, 2008
113.04
-2.758
-2.38%
jan 1, 2009
110.761
-2.279
-2.02%
jan 1, 2010
109.104
-1.658
-1.5%
jan 1, 2011
108.421
-0.682
-0.63%
jan 1, 2012
108.442
+0.02
0.02%
jan 1, 2013
108.116
-0.325
-0.3%
jan 1, 2014
107.78
-0.337
-0.31%
jan 1, 2015
108.694
+0.915
0.85%
Ranking of countries by current statistics by years


Comments: