29
/
en
AIzaSyAYiBZKx7MnpbEhh9jyipgxe19OcubqV5w
April 1, 2024
110991
Congo, Rep.
COG
true
2
1
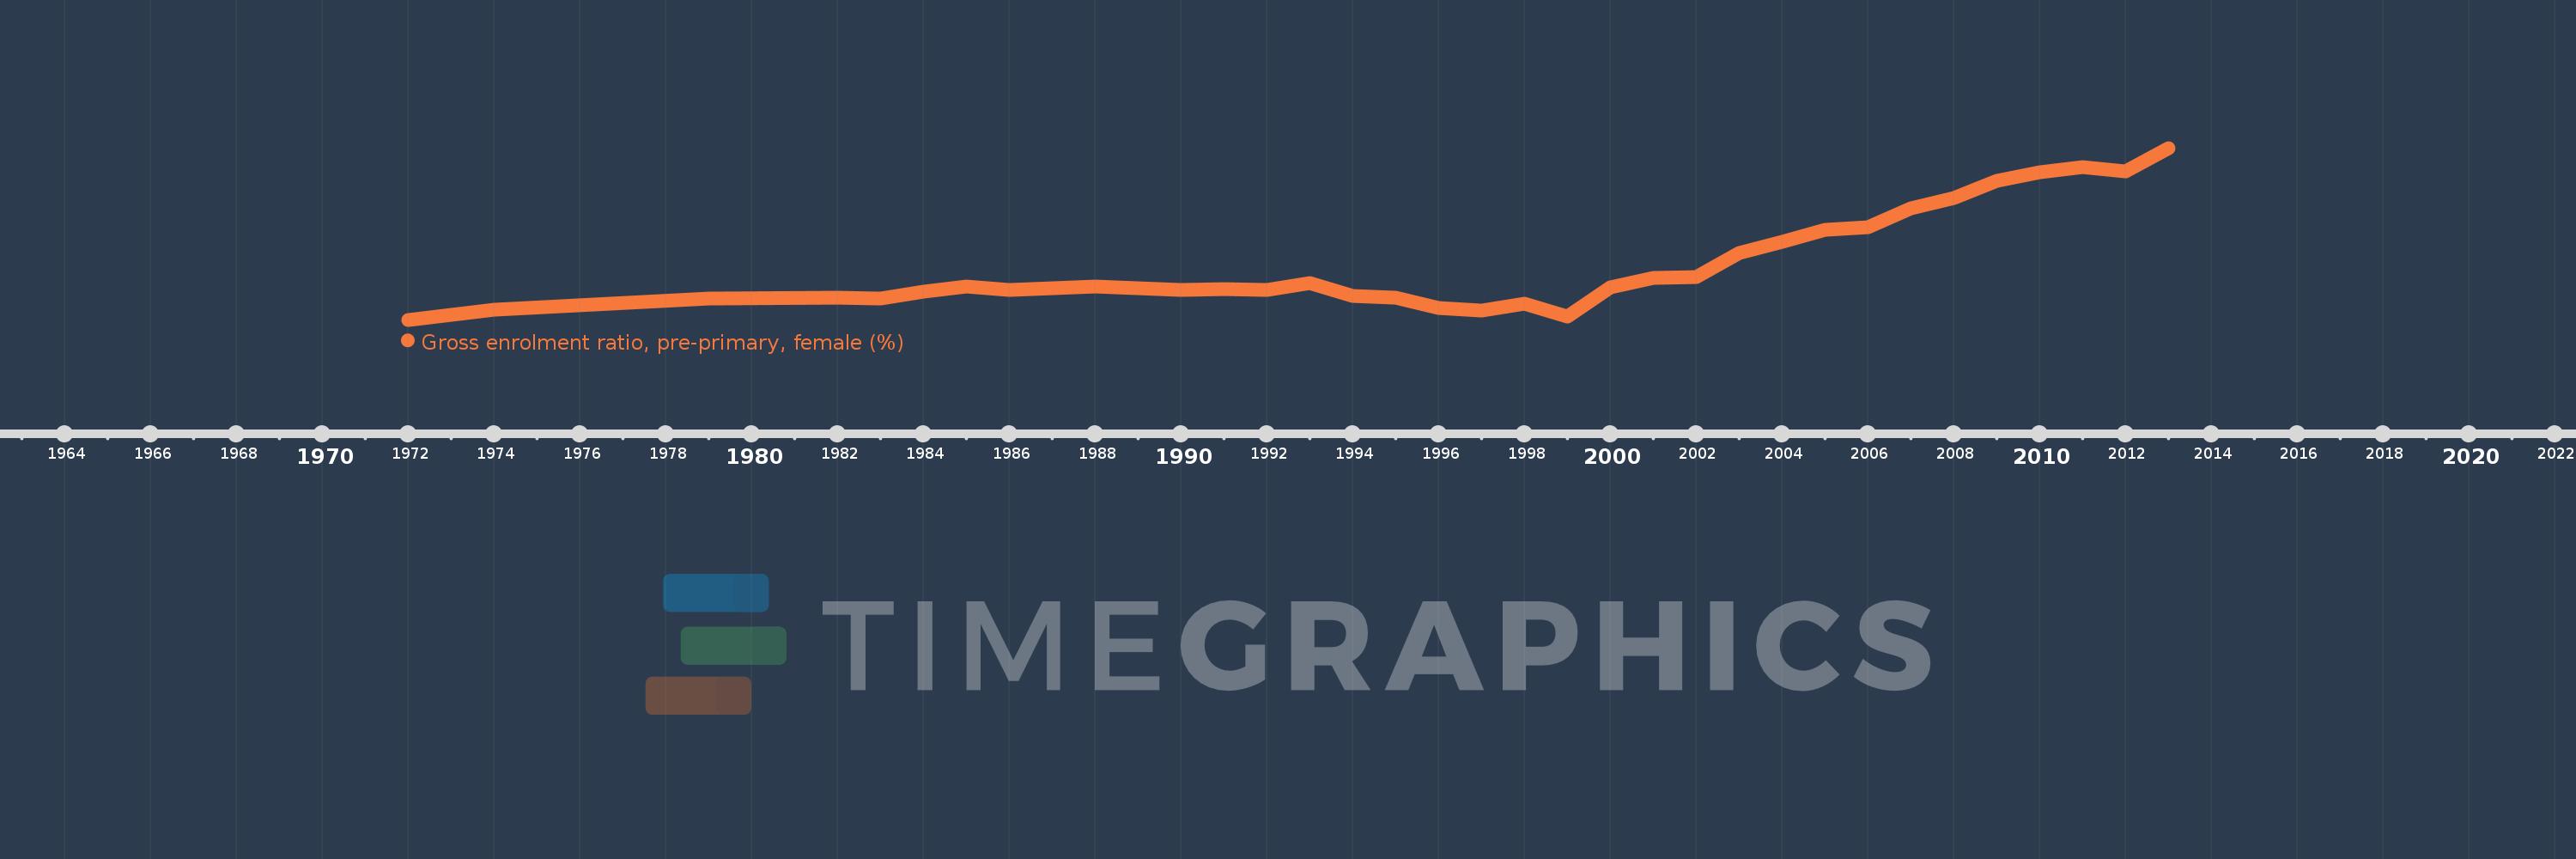
Gross enrolment ratio, pre-primary, female (%)
2013,2012,2011,2010,2009,2008,2007,2006,2005,2004,2003,2002,2001,2000,1999,1998,1997,1996,1995,1994,1993,1992,1991,1990,1989,1988,1987,1986,1985,1984,1983,1982,1979,1974,1972
This statistics in other country:
AfghanistanAlbaniaAlgeriaAndorraAngolaAntigua and BarbudaArab WorldArgentinaArmeniaArubaAustraliaAustriaAzerbaijanBahamas, TheBahrainBangladeshBarbadosBelarusBelgiumBelizeBeninBermudaBhutanBoliviaBosnia and HerzegovinaBotswanaBrazilBrunei DarussalamBulgariaBurkina FasoBurundiCabo VerdeCambodiaCameroonCanadaCaribbean small statesCentral African RepublicCentral Europe and the BalticsChadChileChinaColombiaComorosCongo, Dem. Rep.Congo, Rep.Costa RicaCote d'IvoireCroatiaCubaCyprusCzech RepublicDenmarkDjiboutiDominicaDominican RepublicEarly-demographic dividendEast Asia & PacificEast Asia & Pacific (excluding high income)East Asia & Pacific (IDA & IBRD countries)EcuadorEgypt, Arab Rep.El SalvadorEquatorial GuineaEritreaEstoniaEthiopiaEuro areaEurope & Central AsiaEurope & Central Asia (excluding high income)Europe & Central Asia (IDA & IBRD countries)European UnionFijiFinlandFragile and conflict affected situationsFranceGabonGambia, TheGeorgiaGermanyGhanaGreeceGrenadaGuatemalaGuineaGuinea-BissauGuyanaHeavily indebted poor countries (HIPC)High incomeHondurasHong Kong SAR, ChinaHungaryIBRD onlyIcelandIDA & IBRD totalIDA blendIDA onlyIDA totalIndiaIndonesiaIran, Islamic Rep.IraqIrelandIsraelItalyJamaicaJapanJordanKazakhstanKenyaKorea, Dem. People’s Rep.Korea, Rep.KuwaitKyrgyz RepublicLao PDRLate-demographic dividendLatin America & Caribbean Latin America & Caribbean (excluding high income)Latin America & the Caribbean (IDA & IBRD countries)LatviaLeast developed countries: UN classificationLebanonLesothoLiberiaLibyaLiechtensteinLithuaniaLow & middle incomeLow incomeLower middle incomeLuxembourgMacao SAR, ChinaMacedonia, FYRMadagascarMaldivesMaliMaltaMarshall IslandsMauritaniaMauritiusMexicoMicronesia, Fed. Sts.Middle East & North AfricaMiddle East & North Africa (excluding high income)Middle East & North Africa (IDA & IBRD countries)Middle incomeMoldovaMongoliaMontenegroMoroccoMozambiqueMyanmarNamibiaNauruNepalNetherlandsNew ZealandNicaraguaNigerNigeriaNorth AmericaNorwayOECD membersOmanOther small statesPacific island small statesPakistanPalauPanamaPapua New GuineaParaguayPeruPhilippinesPolandPortugalPost-demographic dividendPre-demographic dividendPuerto RicoQatarRomaniaRussian FederationRwandaSamoaSan MarinoSao Tome and PrincipeSaudi ArabiaSenegalSerbiaSeychellesSierra LeoneSlovak RepublicSloveniaSmall statesSolomon IslandsSomaliaSouth AfricaSouth AsiaSouth Asia (IDA & IBRD)South SudanSpainSri LankaSt. Kitts and NevisSt. LuciaSt. Vincent and the GrenadinesSub-Saharan Africa Sub-Saharan Africa (excluding high income)Sub-Saharan Africa (IDA & IBRD countries)SudanSurinameSwazilandSwedenSwitzerlandSyrian Arab RepublicTajikistanTanzaniaThailandTimor-LesteTogoTongaTrinidad and TobagoTunisiaTurkeyTurkmenistanTuvaluUgandaUkraineUnited Arab EmiratesUnited KingdomUnited StatesUpper middle incomeUruguayUzbekistanVanuatuVenezuela, RBVietnamWest Bank and GazaWorldYemen, Rep.Zimbabwe Timeline:
This timeline shows a graph from 1972 to 2013 of Congo, Rep.. No data until 1971. Number of actual observations by date: 35.
Source name:
World Development Indicators
Source organization:
UNESCO Institute for Statistics
Categories, topics:
Education, Gender
Last updated:
apr 23, 2017
Indicators value changes by year
Maximum:
13.829
jan 1, 2013
At the date of observation
Value
Absolute change
Change from previous value
jan 1, 1972
0.239
+0.239
0.0%
jan 1, 1974
1.015
+0.777
325.6%
jan 1, 1979
1.913
+0.898
88.39%
jan 1, 1982
1.954
+0.041
2.14%
jan 1, 1983
1.944
-0.01
-0.5%
jan 1, 1984
2.431
+0.487
25.05%
jan 1, 1985
2.851
+0.42
17.27%
jan 1, 1986
2.621
-0.23
-8.06%
jan 1, 1987
2.733
+0.111
4.25%
jan 1, 1988
2.874
+0.141
5.16%
jan 1, 1989
2.733
-0.141
-4.91%
jan 1, 1990
2.617
-0.115
-4.22%
jan 1, 1991
2.692
+0.074
2.84%
jan 1, 1992
2.627
-0.065
-2.41%
jan 1, 1993
3.118
+0.491
18.7%
jan 1, 1994
2.122
-0.996
-31.94%
jan 1, 1995
1.962
-0.16
-7.53%
jan 1, 1996
1.147
-0.815
-41.53%
jan 1, 1997
0.933
-0.214
-18.66%
jan 1, 1998
1.529
+0.595
63.81%
jan 1, 1999
0.514
-1.014
-66.35%
jan 1, 2000
2.818
+2.304
447.84%
jan 1, 2001
3.521
+0.703
24.93%
jan 1, 2002
3.593
+0.072
2.04%
jan 1, 2003
5.487
+1.894
52.73%
jan 1, 2004
6.408
+0.921
16.79%
jan 1, 2005
7.336
+0.928
14.48%
jan 1, 2006
7.589
+0.253
3.45%
jan 1, 2007
9.047
+1.458
19.21%
jan 1, 2008
9.859
+0.812
8.98%
jan 1, 2009
11.228
+1.369
13.89%
jan 1, 2010
11.911
+0.683
6.08%
jan 1, 2011
12.33
+0.418
3.51%
jan 1, 2012
11.983
-0.347
-2.81%
jan 1, 2013
13.829
+1.847
15.41%
Ranking of countries by current statistics by years


Comments: