29
/
en
AIzaSyAYiBZKx7MnpbEhh9jyipgxe19OcubqV5w
April 1, 2024
25735
Central Europe and the Baltics
CEB
false
2
1
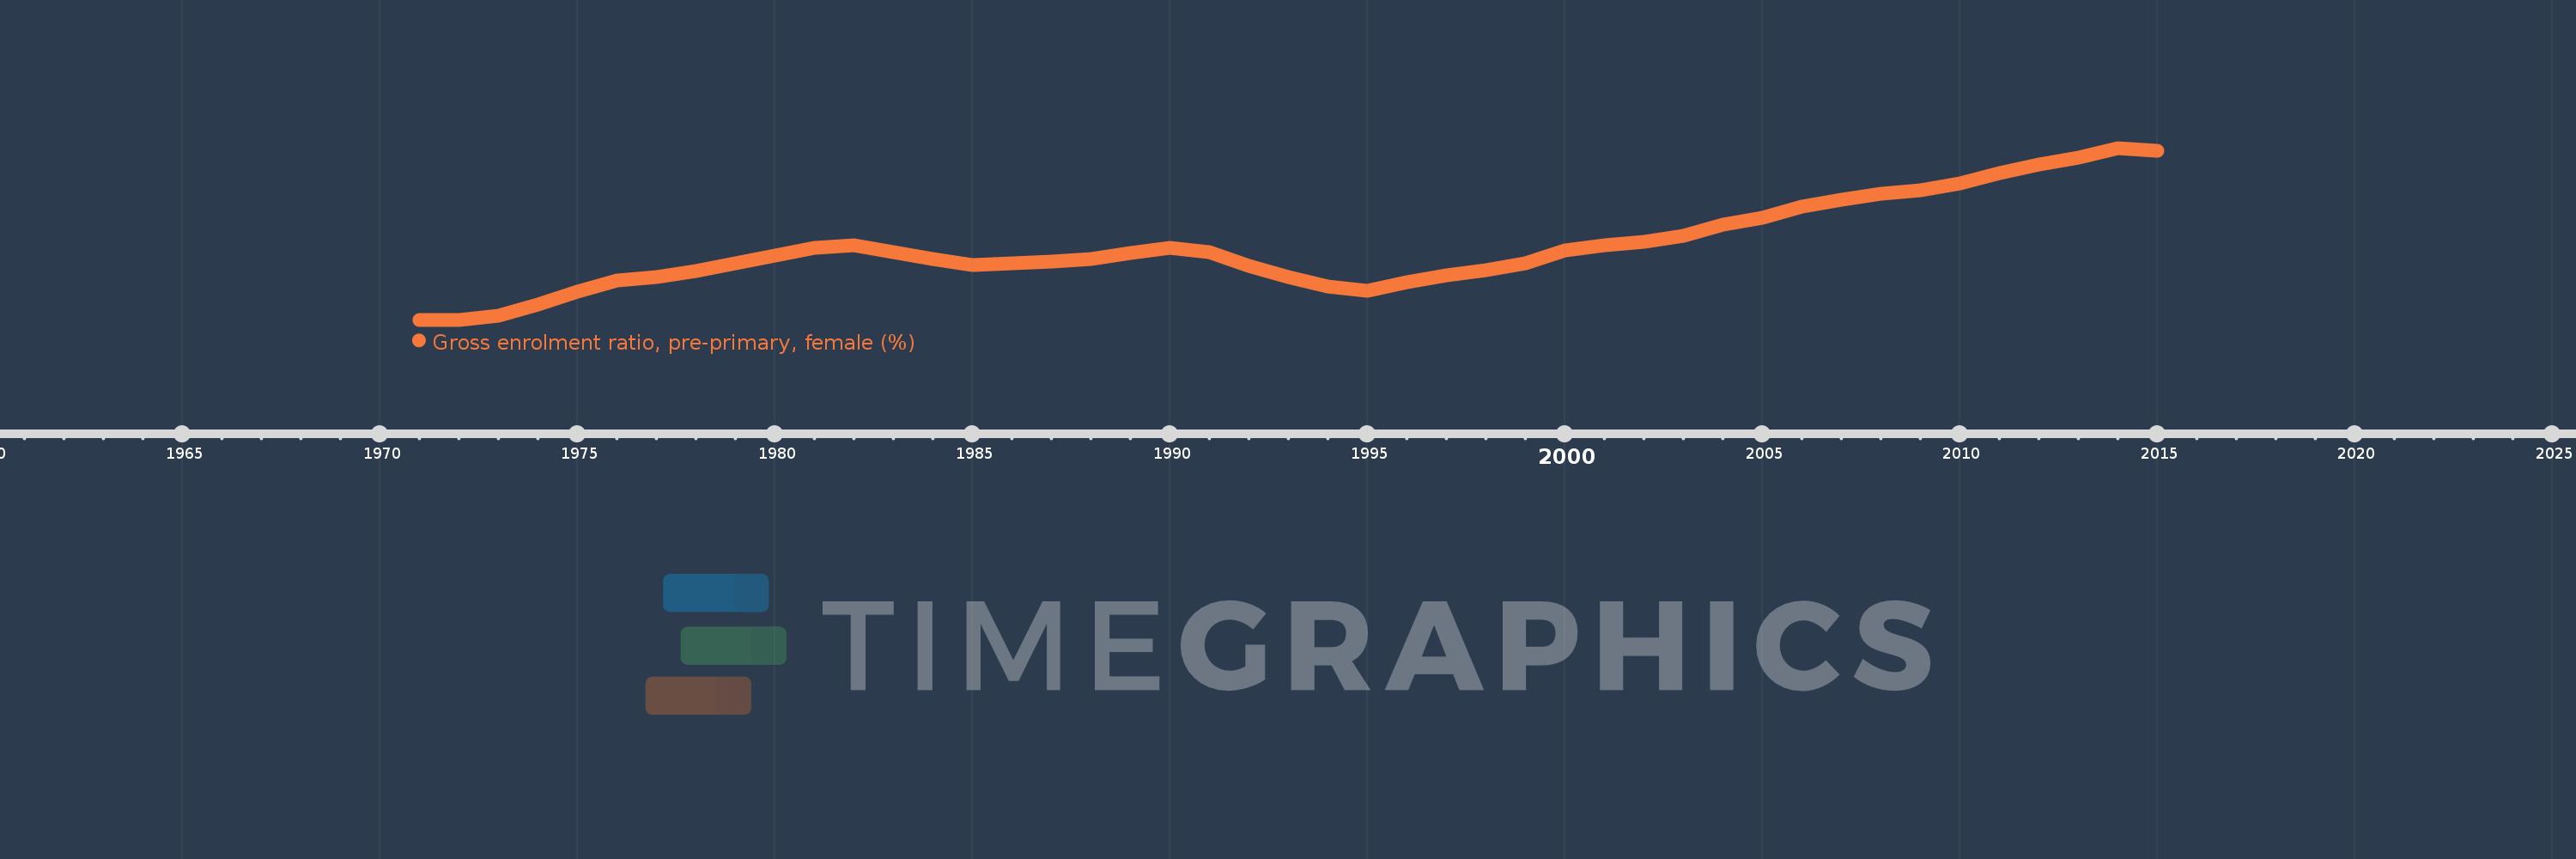
Gross enrolment ratio, pre-primary, female (%)
2015,2014,2013,2012,2011,2010,2009,2008,2007,2006,2005,2004,2003,2002,2001,2000,1999,1998,1997,1996,1995,1994,1993,1992,1991,1990,1989,1988,1987,1986,1985,1984,1983,1982,1981,1980,1979,1978,1977,1976,1975,1974,1973,1972,1971
This statistics in other country:
AfghanistanAlbaniaAlgeriaAndorraAngolaAntigua and BarbudaArab WorldArgentinaArmeniaArubaAustraliaAustriaAzerbaijanBahamas, TheBahrainBangladeshBarbadosBelarusBelgiumBelizeBeninBermudaBhutanBoliviaBosnia and HerzegovinaBotswanaBrazilBrunei DarussalamBulgariaBurkina FasoBurundiCabo VerdeCambodiaCameroonCanadaCaribbean small statesCentral African RepublicCentral Europe and the BalticsChadChileChinaColombiaComorosCongo, Dem. Rep.Congo, Rep.Costa RicaCote d'IvoireCroatiaCubaCyprusCzech RepublicDenmarkDjiboutiDominicaDominican RepublicEarly-demographic dividendEast Asia & PacificEast Asia & Pacific (excluding high income)East Asia & Pacific (IDA & IBRD countries)EcuadorEgypt, Arab Rep.El SalvadorEquatorial GuineaEritreaEstoniaEthiopiaEuro areaEurope & Central AsiaEurope & Central Asia (excluding high income)Europe & Central Asia (IDA & IBRD countries)European UnionFijiFinlandFragile and conflict affected situationsFranceGabonGambia, TheGeorgiaGermanyGhanaGreeceGrenadaGuatemalaGuineaGuinea-BissauGuyanaHeavily indebted poor countries (HIPC)High incomeHondurasHong Kong SAR, ChinaHungaryIBRD onlyIcelandIDA & IBRD totalIDA blendIDA onlyIDA totalIndiaIndonesiaIran, Islamic Rep.IraqIrelandIsraelItalyJamaicaJapanJordanKazakhstanKenyaKorea, Dem. People’s Rep.Korea, Rep.KuwaitKyrgyz RepublicLao PDRLate-demographic dividendLatin America & Caribbean Latin America & Caribbean (excluding high income)Latin America & the Caribbean (IDA & IBRD countries)LatviaLeast developed countries: UN classificationLebanonLesothoLiberiaLibyaLiechtensteinLithuaniaLow & middle incomeLow incomeLower middle incomeLuxembourgMacao SAR, ChinaMacedonia, FYRMadagascarMaldivesMaliMaltaMarshall IslandsMauritaniaMauritiusMexicoMicronesia, Fed. Sts.Middle East & North AfricaMiddle East & North Africa (excluding high income)Middle East & North Africa (IDA & IBRD countries)Middle incomeMoldovaMongoliaMontenegroMoroccoMozambiqueMyanmarNamibiaNauruNepalNetherlandsNew ZealandNicaraguaNigerNigeriaNorth AmericaNorwayOECD membersOmanOther small statesPacific island small statesPakistanPalauPanamaPapua New GuineaParaguayPeruPhilippinesPolandPortugalPost-demographic dividendPre-demographic dividendPuerto RicoQatarRomaniaRussian FederationRwandaSamoaSan MarinoSao Tome and PrincipeSaudi ArabiaSenegalSerbiaSeychellesSierra LeoneSlovak RepublicSloveniaSmall statesSolomon IslandsSomaliaSouth AfricaSouth AsiaSouth Asia (IDA & IBRD)South SudanSpainSri LankaSt. Kitts and NevisSt. LuciaSt. Vincent and the GrenadinesSub-Saharan Africa Sub-Saharan Africa (excluding high income)Sub-Saharan Africa (IDA & IBRD countries)SudanSurinameSwazilandSwedenSwitzerlandSyrian Arab RepublicTajikistanTanzaniaThailandTimor-LesteTogoTongaTrinidad and TobagoTunisiaTurkeyTurkmenistanTuvaluUgandaUkraineUnited Arab EmiratesUnited KingdomUnited StatesUpper middle incomeUruguayUzbekistanVanuatuVenezuela, RBVietnamWest Bank and GazaWorldYemen, Rep.Zimbabwe Timeline:
This timeline shows a graph from 1971 to 2015 of Central Europe and the Baltics. No data until 1970. Number of actual observations by date: 45.
Source name:
World Development Indicators
Source organization:
UNESCO Institute for Statistics
Categories, topics:
Education, Gender
Last updated:
apr 23, 2017
Indicators value changes by year
Minimum:
45.497
jan 1, 1971
Maximum:
84.098
jan 1, 2014
At the date of observation
Value
Absolute change
Change from previous value
jan 1, 1971
45.497
+45.497
0.0%
jan 1, 1972
45.531
+0.034
0.08%
jan 1, 1973
46.419
+0.888
1.95%
jan 1, 1974
48.914
+2.495
5.38%
jan 1, 1975
51.829
+2.915
5.96%
jan 1, 1976
54.27
+2.442
4.71%
jan 1, 1977
55.066
+0.796
1.47%
jan 1, 1978
56.422
+1.356
2.46%
jan 1, 1979
58.156
+1.734
3.07%
jan 1, 1980
59.993
+1.837
3.16%
jan 1, 1981
61.683
+1.69
2.82%
jan 1, 1982
62.149
+0.466
0.76%
jan 1, 1983
60.606
-1.543
-2.48%
jan 1, 1984
59.207
-1.399
-2.31%
jan 1, 1985
57.779
-1.428
-2.41%
jan 1, 1986
58.11
+0.331
0.57%
jan 1, 1987
58.495
+0.385
0.66%
jan 1, 1988
59.221
+0.726
1.24%
jan 1, 1989
60.464
+1.243
2.1%
jan 1, 1990
61.642
+1.178
1.95%
jan 1, 1991
60.781
-0.861
-1.4%
jan 1, 1992
57.631
-3.15
-5.18%
jan 1, 1993
55.016
-2.615
-4.54%
jan 1, 1994
53.058
-1.957
-3.56%
jan 1, 1995
52.048
-1.01
-1.9%
jan 1, 1996
54.016
+1.968
3.78%
jan 1, 1997
55.467
+1.45
2.69%
jan 1, 1998
56.644
+1.177
2.12%
jan 1, 1999
58.267
+1.623
2.86%
jan 1, 2000
61.132
+2.865
4.92%
jan 1, 2001
62.159
+1.027
1.68%
jan 1, 2002
63.088
+0.929
1.49%
jan 1, 2003
64.402
+1.314
2.08%
jan 1, 2004
66.824
+2.421
3.76%
jan 1, 2005
68.466
+1.642
2.46%
jan 1, 2006
70.963
+2.497
3.65%
jan 1, 2007
72.437
+1.474
2.08%
jan 1, 2008
73.802
+1.365
1.88%
jan 1, 2009
74.516
+0.713
0.97%
jan 1, 2010
76.091
+1.575
2.11%
jan 1, 2011
78.365
+2.274
2.99%
jan 1, 2012
80.344
+1.98
2.53%
jan 1, 2013
81.893
+1.549
1.93%
jan 1, 2014
84.098
+2.204
2.69%
jan 1, 2015
83.463
-0.634
-0.75%
Ranking of countries by current statistics by years


Comments: