30
/
AIzaSyAYiBZKx7MnpbEhh9jyipgxe19OcubqV5w
April 1, 2024
233664
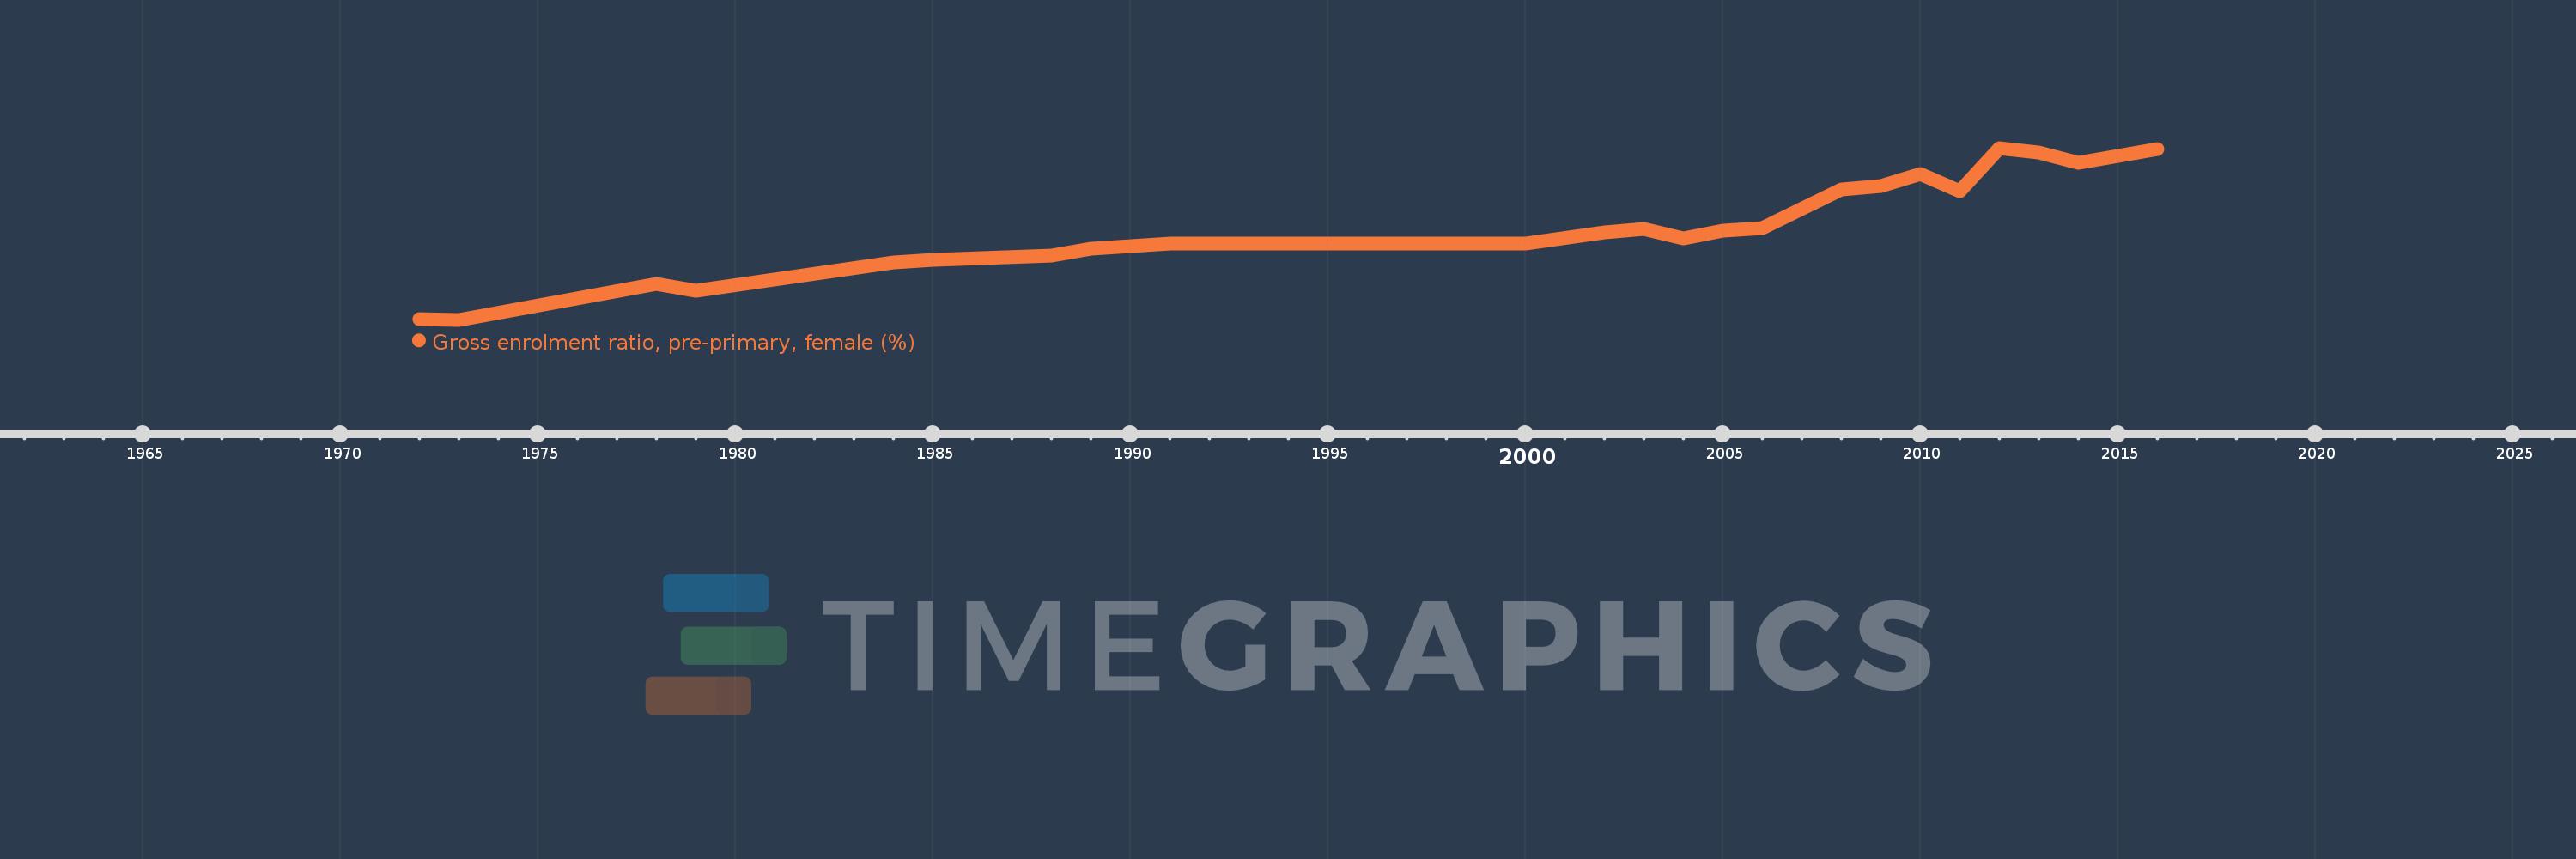
Sao Tome and Principe
STP
true
2
1
Gross enrolment ratio, pre-primary, female (%)
2016,2014,2013,2012,2011,2010,2009,2008,2006,2005,2004,2003,2002,2000,1991,1989,1988,1985,1984,1979,1978,1973,1972
