29
/
en
AIzaSyAYiBZKx7MnpbEhh9jyipgxe19OcubqV5w
April 1, 2024
210423
Nicaragua
NIC
true
2
1
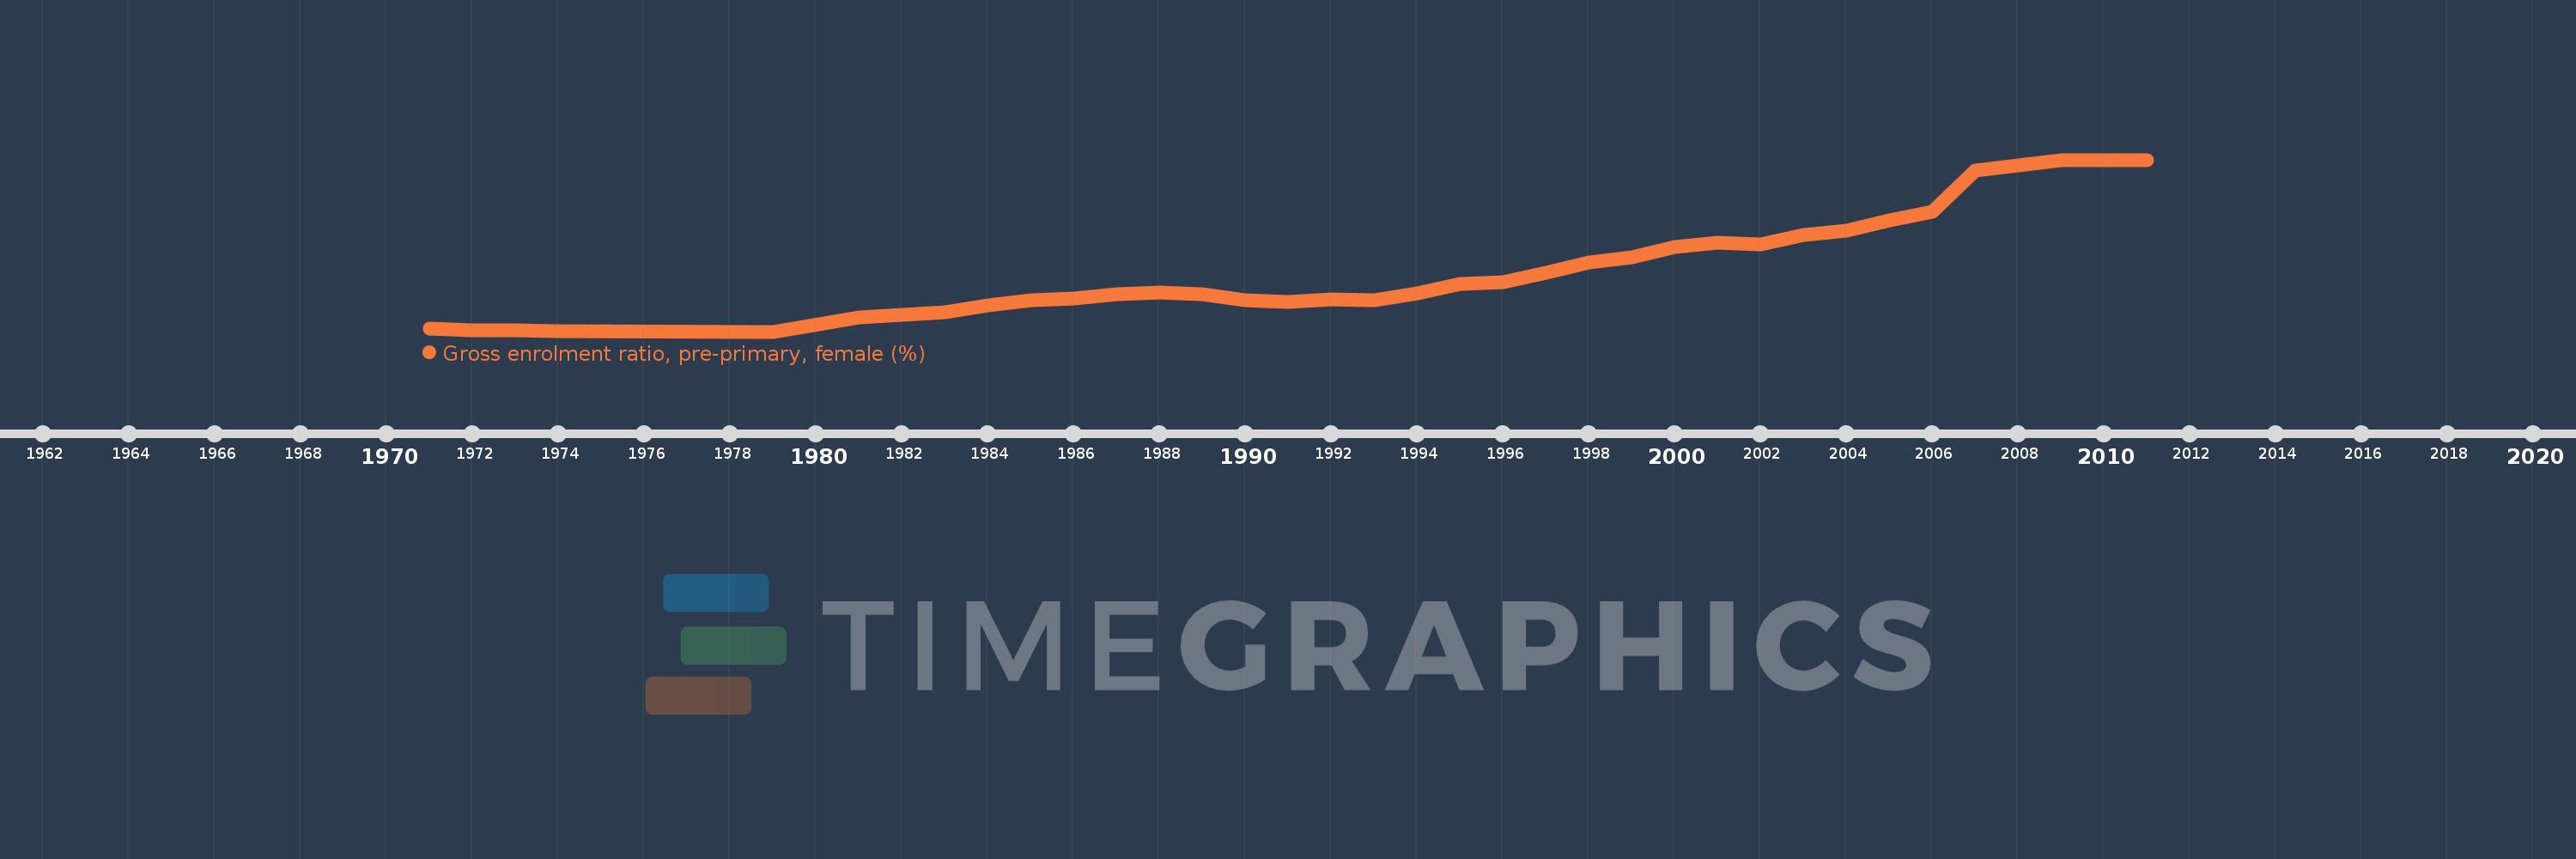
Gross enrolment ratio, pre-primary, female (%)
2011,2009,2008,2007,2006,2005,2004,2003,2002,2001,2000,1999,1998,1997,1996,1995,1994,1993,1992,1991,1990,1989,1988,1987,1986,1985,1984,1983,1981,1979,1974,1973,1972,1971
This statistics in other country:
AfghanistanAlbaniaAlgeriaAndorraAngolaAntigua and BarbudaArab WorldArgentinaArmeniaArubaAustraliaAustriaAzerbaijanBahamas, TheBahrainBangladeshBarbadosBelarusBelgiumBelizeBeninBermudaBhutanBoliviaBosnia and HerzegovinaBotswanaBrazilBrunei DarussalamBulgariaBurkina FasoBurundiCabo VerdeCambodiaCameroonCanadaCaribbean small statesCentral African RepublicCentral Europe and the BalticsChadChileChinaColombiaComorosCongo, Dem. Rep.Congo, Rep.Costa RicaCote d'IvoireCroatiaCubaCyprusCzech RepublicDenmarkDjiboutiDominicaDominican RepublicEarly-demographic dividendEast Asia & PacificEast Asia & Pacific (excluding high income)East Asia & Pacific (IDA & IBRD countries)EcuadorEgypt, Arab Rep.El SalvadorEquatorial GuineaEritreaEstoniaEthiopiaEuro areaEurope & Central AsiaEurope & Central Asia (excluding high income)Europe & Central Asia (IDA & IBRD countries)European UnionFijiFinlandFragile and conflict affected situationsFranceGabonGambia, TheGeorgiaGermanyGhanaGreeceGrenadaGuatemalaGuineaGuinea-BissauGuyanaHeavily indebted poor countries (HIPC)High incomeHondurasHong Kong SAR, ChinaHungaryIBRD onlyIcelandIDA & IBRD totalIDA blendIDA onlyIDA totalIndiaIndonesiaIran, Islamic Rep.IraqIrelandIsraelItalyJamaicaJapanJordanKazakhstanKenyaKorea, Dem. People’s Rep.Korea, Rep.KuwaitKyrgyz RepublicLao PDRLate-demographic dividendLatin America & Caribbean Latin America & Caribbean (excluding high income)Latin America & the Caribbean (IDA & IBRD countries)LatviaLeast developed countries: UN classificationLebanonLesothoLiberiaLibyaLiechtensteinLithuaniaLow & middle incomeLow incomeLower middle incomeLuxembourgMacao SAR, ChinaMacedonia, FYRMadagascarMaldivesMaliMaltaMarshall IslandsMauritaniaMauritiusMexicoMicronesia, Fed. Sts.Middle East & North AfricaMiddle East & North Africa (excluding high income)Middle East & North Africa (IDA & IBRD countries)Middle incomeMoldovaMongoliaMontenegroMoroccoMozambiqueMyanmarNamibiaNauruNepalNetherlandsNew ZealandNicaraguaNigerNigeriaNorth AmericaNorwayOECD membersOmanOther small statesPacific island small statesPakistanPalauPanamaPapua New GuineaParaguayPeruPhilippinesPolandPortugalPost-demographic dividendPre-demographic dividendPuerto RicoQatarRomaniaRussian FederationRwandaSamoaSan MarinoSao Tome and PrincipeSaudi ArabiaSenegalSerbiaSeychellesSierra LeoneSlovak RepublicSloveniaSmall statesSolomon IslandsSomaliaSouth AfricaSouth AsiaSouth Asia (IDA & IBRD)South SudanSpainSri LankaSt. Kitts and NevisSt. LuciaSt. Vincent and the GrenadinesSub-Saharan Africa Sub-Saharan Africa (excluding high income)Sub-Saharan Africa (IDA & IBRD countries)SudanSurinameSwazilandSwedenSwitzerlandSyrian Arab RepublicTajikistanTanzaniaThailandTimor-LesteTogoTongaTrinidad and TobagoTunisiaTurkeyTurkmenistanTuvaluUgandaUkraineUnited Arab EmiratesUnited KingdomUnited StatesUpper middle incomeUruguayUzbekistanVanuatuVenezuela, RBVietnamWest Bank and GazaWorldYemen, Rep.Zimbabwe Timeline:
This timeline shows a graph from 1971 to 2011 of Nicaragua. No data until 1970. Number of actual observations by date: 34.
Source name:
World Development Indicators
Source organization:
UNESCO Institute for Statistics
Categories, topics:
Education, Gender
Last updated:
apr 23, 2017
Indicators value changes by year
Maximum:
59.236
jan 1, 2011
At the date of observation
Value
Absolute change
Change from previous value
jan 1, 1971
3.406
+3.406
0.0%
jan 1, 1972
2.74
-0.667
-19.57%
jan 1, 1973
2.764
+0.025
0.9%
jan 1, 1974
2.441
-0.323
-11.68%
jan 1, 1979
2.32
-0.122
-4.98%
jan 1, 1981
7.15
+4.831
208.24%
jan 1, 1983
8.742
+1.592
22.26%
jan 1, 1984
10.98
+2.238
25.6%
jan 1, 1985
12.807
+1.827
16.64%
jan 1, 1986
13.153
+0.346
2.7%
jan 1, 1987
14.702
+1.549
11.78%
jan 1, 1988
15.385
+0.682
4.64%
jan 1, 1989
14.614
-0.771
-5.01%
jan 1, 1990
12.642
-1.972
-13.49%
jan 1, 1991
12.174
-0.467
-3.7%
jan 1, 1992
13.115
+0.941
7.73%
jan 1, 1993
12.739
-0.377
-2.87%
jan 1, 1994
15.004
+2.265
17.78%
jan 1, 1995
18.227
+3.223
21.48%
jan 1, 1996
18.669
+0.443
2.43%
jan 1, 1997
21.72
+3.051
16.34%
jan 1, 1998
25.103
+3.382
15.57%
jan 1, 1999
26.938
+1.835
7.31%
jan 1, 2000
30.443
+3.504
13.01%
jan 1, 2001
31.754
+1.312
4.31%
jan 1, 2002
31.166
-0.588
-1.85%
jan 1, 2003
34.303
+3.137
10.06%
jan 1, 2004
35.801
+1.498
4.37%
jan 1, 2005
39.106
+3.304
9.23%
jan 1, 2006
41.971
+2.866
7.33%
jan 1, 2007
55.556
+13.584
32.37%
jan 1, 2008
57.26
+1.705
3.07%
jan 1, 2009
59.096
+1.835
3.21%
jan 1, 2011
59.236
+0.141
0.24%
Ranking of countries by current statistics by years


Comments: