29
/
en
AIzaSyAYiBZKx7MnpbEhh9jyipgxe19OcubqV5w
April 1, 2024
35777
High income
HIC
false
2
1
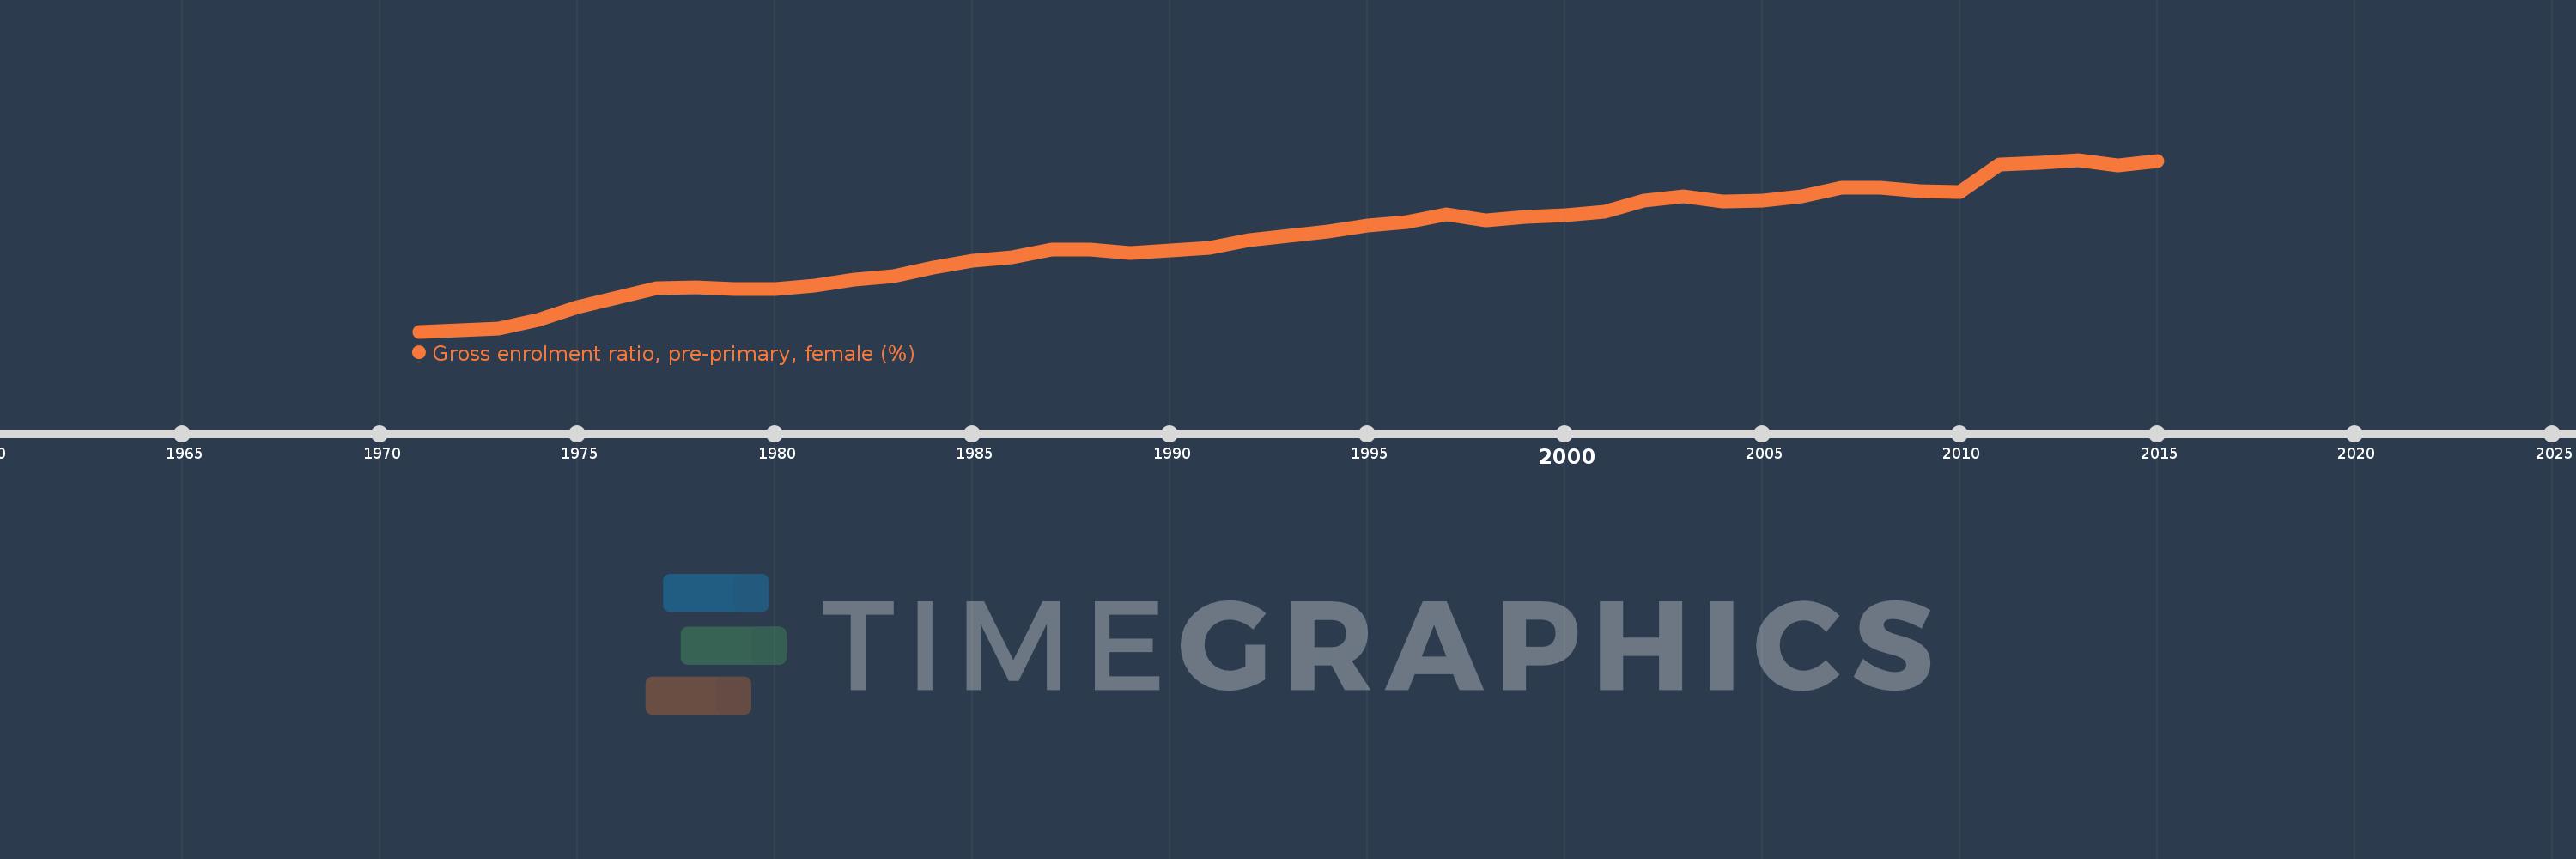
Gross enrolment ratio, pre-primary, female (%)
2015,2014,2013,2012,2011,2010,2009,2008,2007,2006,2005,2004,2003,2002,2001,2000,1999,1998,1997,1996,1995,1994,1993,1992,1991,1990,1989,1988,1987,1986,1985,1984,1983,1982,1981,1980,1979,1978,1977,1976,1975,1974,1973,1972,1971
This statistics in other country:
AfghanistanAlbaniaAlgeriaAndorraAngolaAntigua and BarbudaArab WorldArgentinaArmeniaArubaAustraliaAustriaAzerbaijanBahamas, TheBahrainBangladeshBarbadosBelarusBelgiumBelizeBeninBermudaBhutanBoliviaBosnia and HerzegovinaBotswanaBrazilBrunei DarussalamBulgariaBurkina FasoBurundiCabo VerdeCambodiaCameroonCanadaCaribbean small statesCentral African RepublicCentral Europe and the BalticsChadChileChinaColombiaComorosCongo, Dem. Rep.Congo, Rep.Costa RicaCote d'IvoireCroatiaCubaCyprusCzech RepublicDenmarkDjiboutiDominicaDominican RepublicEarly-demographic dividendEast Asia & PacificEast Asia & Pacific (excluding high income)East Asia & Pacific (IDA & IBRD countries)EcuadorEgypt, Arab Rep.El SalvadorEquatorial GuineaEritreaEstoniaEthiopiaEuro areaEurope & Central AsiaEurope & Central Asia (excluding high income)Europe & Central Asia (IDA & IBRD countries)European UnionFijiFinlandFragile and conflict affected situationsFranceGabonGambia, TheGeorgiaGermanyGhanaGreeceGrenadaGuatemalaGuineaGuinea-BissauGuyanaHeavily indebted poor countries (HIPC)High incomeHondurasHong Kong SAR, ChinaHungaryIBRD onlyIcelandIDA & IBRD totalIDA blendIDA onlyIDA totalIndiaIndonesiaIran, Islamic Rep.IraqIrelandIsraelItalyJamaicaJapanJordanKazakhstanKenyaKorea, Dem. People’s Rep.Korea, Rep.KuwaitKyrgyz RepublicLao PDRLate-demographic dividendLatin America & Caribbean Latin America & Caribbean (excluding high income)Latin America & the Caribbean (IDA & IBRD countries)LatviaLeast developed countries: UN classificationLebanonLesothoLiberiaLibyaLiechtensteinLithuaniaLow & middle incomeLow incomeLower middle incomeLuxembourgMacao SAR, ChinaMacedonia, FYRMadagascarMaldivesMaliMaltaMarshall IslandsMauritaniaMauritiusMexicoMicronesia, Fed. Sts.Middle East & North AfricaMiddle East & North Africa (excluding high income)Middle East & North Africa (IDA & IBRD countries)Middle incomeMoldovaMongoliaMontenegroMoroccoMozambiqueMyanmarNamibiaNauruNepalNetherlandsNew ZealandNicaraguaNigerNigeriaNorth AmericaNorwayOECD membersOmanOther small statesPacific island small statesPakistanPalauPanamaPapua New GuineaParaguayPeruPhilippinesPolandPortugalPost-demographic dividendPre-demographic dividendPuerto RicoQatarRomaniaRussian FederationRwandaSamoaSan MarinoSao Tome and PrincipeSaudi ArabiaSenegalSerbiaSeychellesSierra LeoneSlovak RepublicSloveniaSmall statesSolomon IslandsSomaliaSouth AfricaSouth AsiaSouth Asia (IDA & IBRD)South SudanSpainSri LankaSt. Kitts and NevisSt. LuciaSt. Vincent and the GrenadinesSub-Saharan Africa Sub-Saharan Africa (excluding high income)Sub-Saharan Africa (IDA & IBRD countries)SudanSurinameSwazilandSwedenSwitzerlandSyrian Arab RepublicTajikistanTanzaniaThailandTimor-LesteTogoTongaTrinidad and TobagoTunisiaTurkeyTurkmenistanTuvaluUgandaUkraineUnited Arab EmiratesUnited KingdomUnited StatesUpper middle incomeUruguayUzbekistanVanuatuVenezuela, RBVietnamWest Bank and GazaWorldYemen, Rep.Zimbabwe Timeline:
This timeline shows a graph from 1971 to 2015 of High income. No data until 1970. Number of actual observations by date: 45.
Source name:
World Development Indicators
Source organization:
UNESCO Institute for Statistics
Categories, topics:
Education, Gender
Last updated:
apr 23, 2017
Indicators value changes by year
Minimum:
46.231
jan 1, 1971
Maximum:
83.792
jan 1, 2013
At the date of observation
Value
Absolute change
Change from previous value
jan 1, 1971
46.231
+46.231
0.0%
jan 1, 1972
46.456
+0.225
0.49%
jan 1, 1973
46.974
+0.518
1.12%
jan 1, 1974
48.822
+1.848
3.93%
jan 1, 1975
51.557
+2.735
5.6%
jan 1, 1976
53.621
+2.064
4.0%
jan 1, 1977
55.693
+2.072
3.86%
jan 1, 1978
55.864
+0.171
0.31%
jan 1, 1979
55.457
-0.407
-0.73%
jan 1, 1980
55.621
+0.164
0.3%
jan 1, 1981
56.241
+0.62
1.11%
jan 1, 1982
57.657
+1.416
2.52%
jan 1, 1983
58.27
+0.613
1.06%
jan 1, 1984
60.149
+1.879
3.22%
jan 1, 1985
61.776
+1.627
2.71%
jan 1, 1986
62.46
+0.685
1.11%
jan 1, 1987
64.234
+1.774
2.84%
jan 1, 1988
64.104
-0.13
-0.2%
jan 1, 1989
63.506
-0.598
-0.93%
jan 1, 1990
63.893
+0.387
0.61%
jan 1, 1991
64.596
+0.703
1.1%
jan 1, 1992
66.148
+1.552
2.4%
jan 1, 1993
67.171
+1.023
1.55%
jan 1, 1994
68.204
+1.032
1.54%
jan 1, 1995
69.435
+1.232
1.81%
jan 1, 1996
70.17
+0.734
1.06%
jan 1, 1997
71.839
+1.669
2.38%
jan 1, 1998
70.635
-1.203
-1.68%
jan 1, 1999
71.251
+0.615
0.87%
jan 1, 2000
71.733
+0.482
0.68%
jan 1, 2001
72.511
+0.779
1.09%
jan 1, 2002
74.787
+2.276
3.14%
jan 1, 2003
75.783
+0.995
1.33%
jan 1, 2004
74.668
-1.115
-1.47%
jan 1, 2005
74.855
+0.188
0.25%
jan 1, 2006
75.861
+1.005
1.34%
jan 1, 2007
77.689
+1.829
2.41%
jan 1, 2008
77.72
+0.03
0.04%
jan 1, 2009
76.877
-0.842
-1.08%
jan 1, 2010
76.785
-0.092
-0.12%
jan 1, 2011
82.724
+5.939
7.73%
jan 1, 2012
83.124
+0.4
0.48%
jan 1, 2013
83.792
+0.668
0.8%
jan 1, 2014
82.551
-1.241
-1.48%
jan 1, 2015
83.444
+0.894
1.08%
Ranking of countries by current statistics by years


Comments: