29
/
en
AIzaSyAYiBZKx7MnpbEhh9jyipgxe19OcubqV5w
April 1, 2024
150428
Honduras
HND
true
2
1
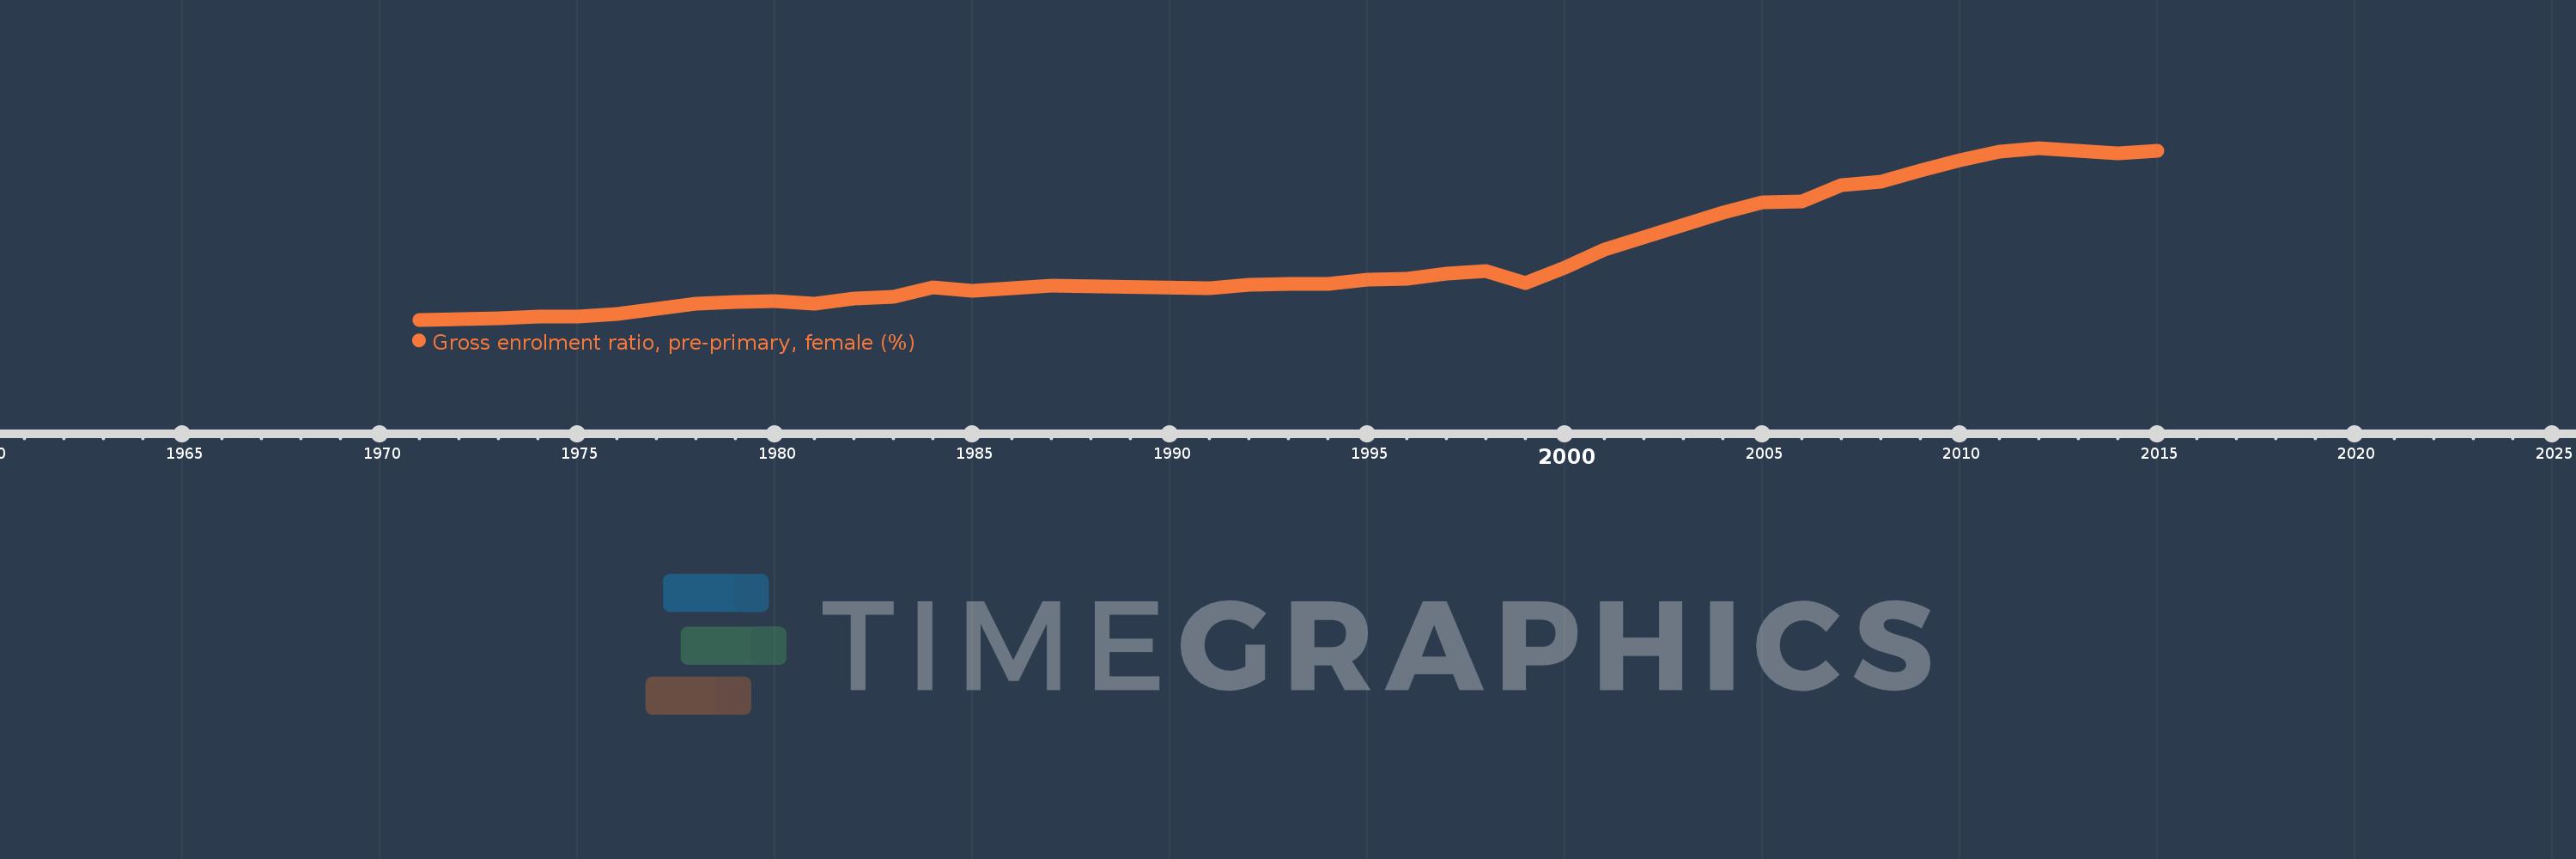
Gross enrolment ratio, pre-primary, female (%)
2015,2014,2013,2012,2011,2010,2009,2008,2007,2006,2005,2004,2001,2000,1999,1998,1997,1996,1995,1994,1993,1992,1991,1987,1985,1984,1983,1982,1981,1980,1979,1978,1977,1976,1975,1974,1973,1972,1971
This statistics in other country:
AfghanistanAlbaniaAlgeriaAndorraAngolaAntigua and BarbudaArab WorldArgentinaArmeniaArubaAustraliaAustriaAzerbaijanBahamas, TheBahrainBangladeshBarbadosBelarusBelgiumBelizeBeninBermudaBhutanBoliviaBosnia and HerzegovinaBotswanaBrazilBrunei DarussalamBulgariaBurkina FasoBurundiCabo VerdeCambodiaCameroonCanadaCaribbean small statesCentral African RepublicCentral Europe and the BalticsChadChileChinaColombiaComorosCongo, Dem. Rep.Congo, Rep.Costa RicaCote d'IvoireCroatiaCubaCyprusCzech RepublicDenmarkDjiboutiDominicaDominican RepublicEarly-demographic dividendEast Asia & PacificEast Asia & Pacific (excluding high income)East Asia & Pacific (IDA & IBRD countries)EcuadorEgypt, Arab Rep.El SalvadorEquatorial GuineaEritreaEstoniaEthiopiaEuro areaEurope & Central AsiaEurope & Central Asia (excluding high income)Europe & Central Asia (IDA & IBRD countries)European UnionFijiFinlandFragile and conflict affected situationsFranceGabonGambia, TheGeorgiaGermanyGhanaGreeceGrenadaGuatemalaGuineaGuinea-BissauGuyanaHeavily indebted poor countries (HIPC)High incomeHondurasHong Kong SAR, ChinaHungaryIBRD onlyIcelandIDA & IBRD totalIDA blendIDA onlyIDA totalIndiaIndonesiaIran, Islamic Rep.IraqIrelandIsraelItalyJamaicaJapanJordanKazakhstanKenyaKorea, Dem. People’s Rep.Korea, Rep.KuwaitKyrgyz RepublicLao PDRLate-demographic dividendLatin America & Caribbean Latin America & Caribbean (excluding high income)Latin America & the Caribbean (IDA & IBRD countries)LatviaLeast developed countries: UN classificationLebanonLesothoLiberiaLibyaLiechtensteinLithuaniaLow & middle incomeLow incomeLower middle incomeLuxembourgMacao SAR, ChinaMacedonia, FYRMadagascarMaldivesMaliMaltaMarshall IslandsMauritaniaMauritiusMexicoMicronesia, Fed. Sts.Middle East & North AfricaMiddle East & North Africa (excluding high income)Middle East & North Africa (IDA & IBRD countries)Middle incomeMoldovaMongoliaMontenegroMoroccoMozambiqueMyanmarNamibiaNauruNepalNetherlandsNew ZealandNicaraguaNigerNigeriaNorth AmericaNorwayOECD membersOmanOther small statesPacific island small statesPakistanPalauPanamaPapua New GuineaParaguayPeruPhilippinesPolandPortugalPost-demographic dividendPre-demographic dividendPuerto RicoQatarRomaniaRussian FederationRwandaSamoaSan MarinoSao Tome and PrincipeSaudi ArabiaSenegalSerbiaSeychellesSierra LeoneSlovak RepublicSloveniaSmall statesSolomon IslandsSomaliaSouth AfricaSouth AsiaSouth Asia (IDA & IBRD)South SudanSpainSri LankaSt. Kitts and NevisSt. LuciaSt. Vincent and the GrenadinesSub-Saharan Africa Sub-Saharan Africa (excluding high income)Sub-Saharan Africa (IDA & IBRD countries)SudanSurinameSwazilandSwedenSwitzerlandSyrian Arab RepublicTajikistanTanzaniaThailandTimor-LesteTogoTongaTrinidad and TobagoTunisiaTurkeyTurkmenistanTuvaluUgandaUkraineUnited Arab EmiratesUnited KingdomUnited StatesUpper middle incomeUruguayUzbekistanVanuatuVenezuela, RBVietnamWest Bank and GazaWorldYemen, Rep.Zimbabwe Timeline:
This timeline shows a graph from 1971 to 2015 of Honduras. No data until 1970. Number of actual observations by date: 39.
Source name:
World Development Indicators
Source organization:
UNESCO Institute for Statistics
Categories, topics:
Education, Gender
Last updated:
apr 23, 2017
Indicators value changes by year
Maximum:
48.471
jan 1, 2012
At the date of observation
Value
Absolute change
Change from previous value
jan 1, 1971
3.705
+3.705
0.0%
jan 1, 1972
3.969
+0.263
7.11%
jan 1, 1973
4.113
+0.144
3.64%
jan 1, 1974
4.538
+0.425
10.34%
jan 1, 1975
4.477
-0.062
-1.36%
jan 1, 1976
5.186
+0.71
15.86%
jan 1, 1977
6.586
+1.4
26.99%
jan 1, 1978
7.908
+1.322
20.07%
jan 1, 1979
8.3
+0.392
4.95%
jan 1, 1980
8.575
+0.276
3.32%
jan 1, 1981
7.927
-0.648
-7.56%
jan 1, 1982
9.154
+1.227
15.48%
jan 1, 1983
9.785
+0.631
6.89%
jan 1, 1984
12.14
+2.355
24.07%
jan 1, 1985
11.351
-0.79
-6.5%
jan 1, 1987
12.665
+1.314
11.58%
jan 1, 1991
11.935
-0.729
-5.76%
jan 1, 1992
12.809
+0.874
7.32%
jan 1, 1993
13.058
+0.249
1.94%
jan 1, 1994
12.991
-0.067
-0.51%
jan 1, 1995
14.054
+1.063
8.18%
jan 1, 1996
14.272
+0.218
1.55%
jan 1, 1997
15.677
+1.405
9.85%
jan 1, 1998
16.476
+0.799
5.1%
jan 1, 1999
13.278
-3.198
-19.41%
jan 1, 2000
17.34
+4.063
30.6%
jan 1, 2001
22.078
+4.738
27.32%
jan 1, 2004
31.514
+9.436
42.74%
jan 1, 2005
34.332
+2.819
8.94%
jan 1, 2006
34.544
+0.211
0.62%
jan 1, 2007
38.84
+4.296
12.44%
jan 1, 2008
39.637
+0.797
2.05%
jan 1, 2009
42.545
+2.907
7.33%
jan 1, 2010
45.195
+2.651
6.23%
jan 1, 2011
47.408
+2.213
4.9%
jan 1, 2012
48.471
+1.063
2.24%
jan 1, 2013
47.652
-0.819
-1.69%
jan 1, 2014
47.159
-0.493
-1.03%
jan 1, 2015
47.653
+0.494
1.05%
Ranking of countries by current statistics by years


Comments: