29
/
en
AIzaSyAYiBZKx7MnpbEhh9jyipgxe19OcubqV5w
April 1, 2024
62637
World
WLD
false
2
1
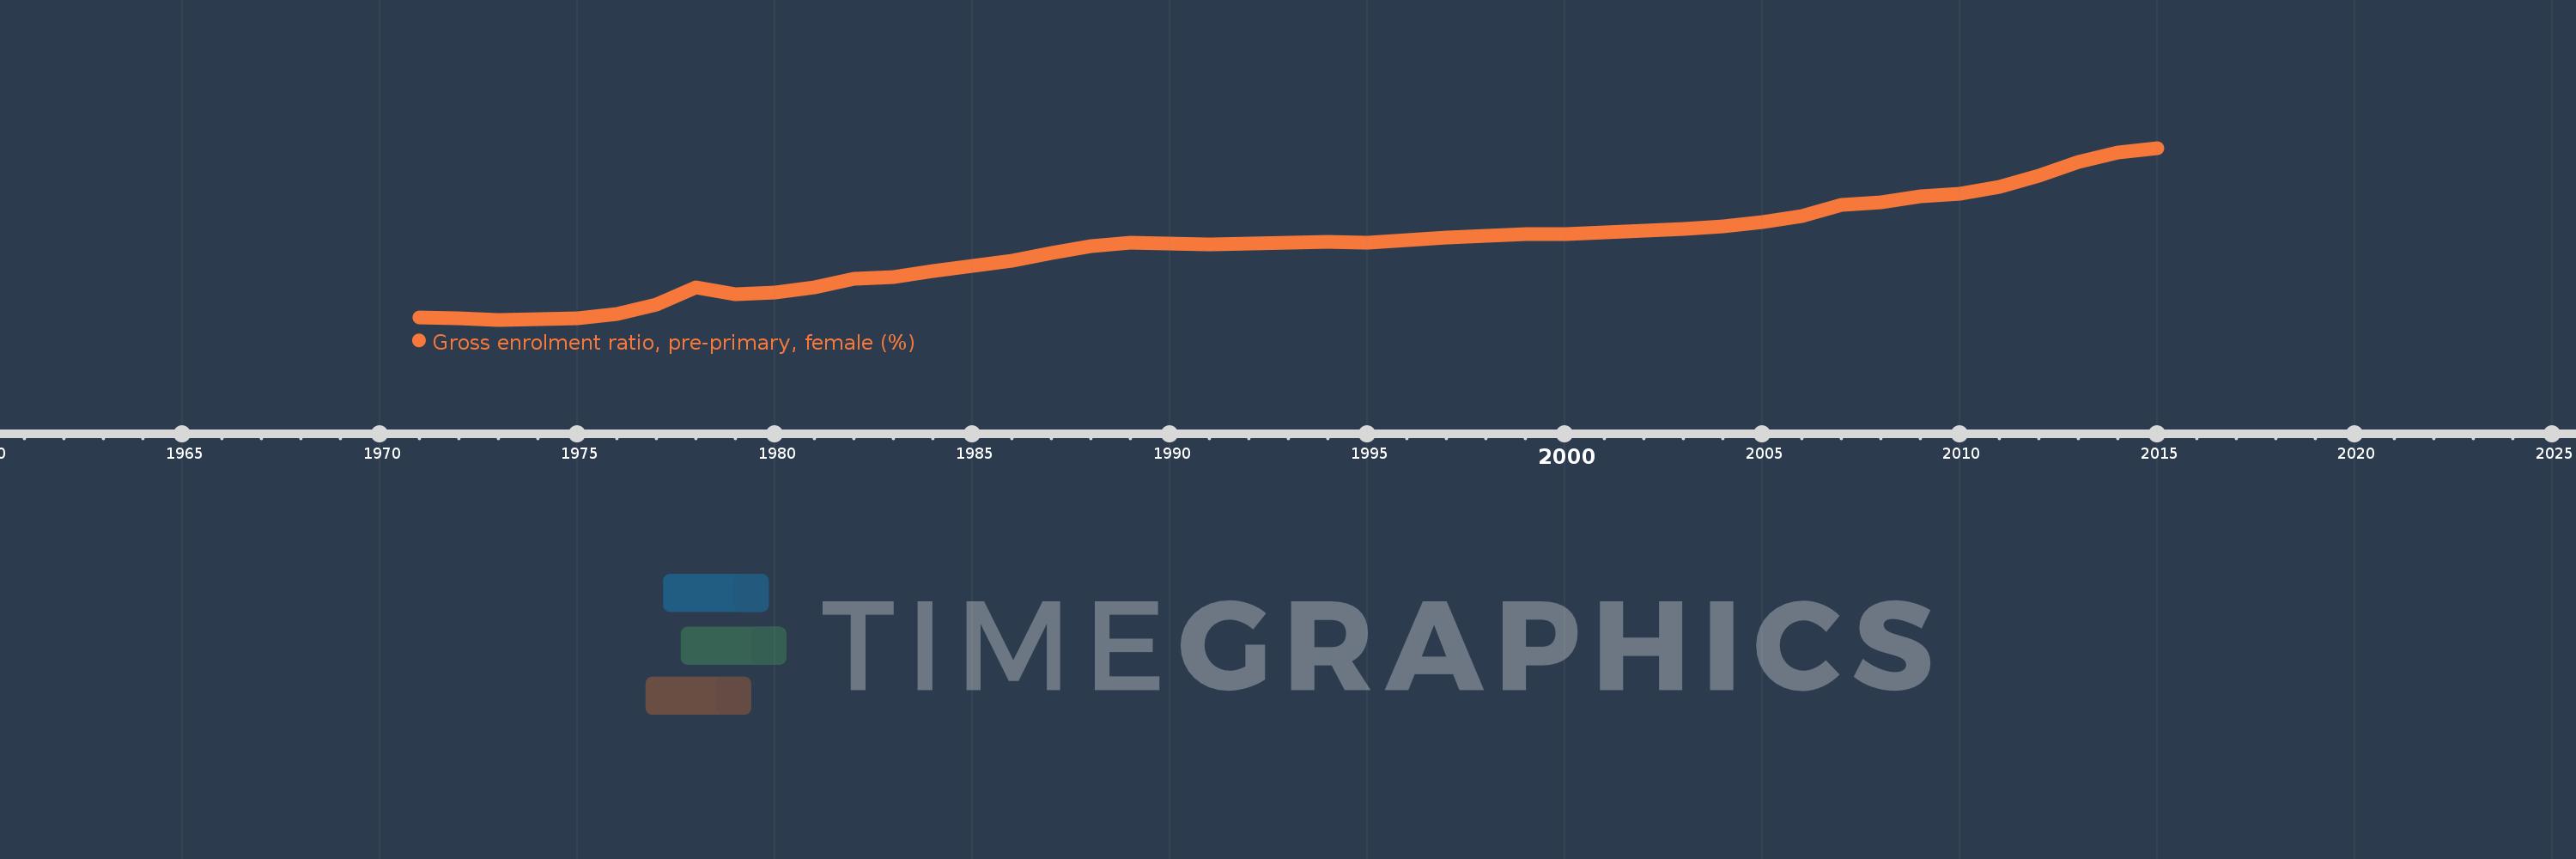
Gross enrolment ratio, pre-primary, female (%)
2015,2014,2013,2012,2011,2010,2009,2008,2007,2006,2005,2004,2003,2002,2001,2000,1999,1998,1997,1996,1995,1994,1993,1992,1991,1990,1989,1988,1987,1986,1985,1984,1983,1982,1981,1980,1979,1978,1977,1976,1975,1974,1973,1972,1971
This statistics in other country:
AfghanistanAlbaniaAlgeriaAndorraAngolaAntigua and BarbudaArab WorldArgentinaArmeniaArubaAustraliaAustriaAzerbaijanBahamas, TheBahrainBangladeshBarbadosBelarusBelgiumBelizeBeninBermudaBhutanBoliviaBosnia and HerzegovinaBotswanaBrazilBrunei DarussalamBulgariaBurkina FasoBurundiCabo VerdeCambodiaCameroonCanadaCaribbean small statesCentral African RepublicCentral Europe and the BalticsChadChileChinaColombiaComorosCongo, Dem. Rep.Congo, Rep.Costa RicaCote d'IvoireCroatiaCubaCyprusCzech RepublicDenmarkDjiboutiDominicaDominican RepublicEarly-demographic dividendEast Asia & PacificEast Asia & Pacific (excluding high income)East Asia & Pacific (IDA & IBRD countries)EcuadorEgypt, Arab Rep.El SalvadorEquatorial GuineaEritreaEstoniaEthiopiaEuro areaEurope & Central AsiaEurope & Central Asia (excluding high income)Europe & Central Asia (IDA & IBRD countries)European UnionFijiFinlandFragile and conflict affected situationsFranceGabonGambia, TheGeorgiaGermanyGhanaGreeceGrenadaGuatemalaGuineaGuinea-BissauGuyanaHeavily indebted poor countries (HIPC)High incomeHondurasHong Kong SAR, ChinaHungaryIBRD onlyIcelandIDA & IBRD totalIDA blendIDA onlyIDA totalIndiaIndonesiaIran, Islamic Rep.IraqIrelandIsraelItalyJamaicaJapanJordanKazakhstanKenyaKorea, Dem. People’s Rep.Korea, Rep.KuwaitKyrgyz RepublicLao PDRLate-demographic dividendLatin America & Caribbean Latin America & Caribbean (excluding high income)Latin America & the Caribbean (IDA & IBRD countries)LatviaLeast developed countries: UN classificationLebanonLesothoLiberiaLibyaLiechtensteinLithuaniaLow & middle incomeLow incomeLower middle incomeLuxembourgMacao SAR, ChinaMacedonia, FYRMadagascarMaldivesMaliMaltaMarshall IslandsMauritaniaMauritiusMexicoMicronesia, Fed. Sts.Middle East & North AfricaMiddle East & North Africa (excluding high income)Middle East & North Africa (IDA & IBRD countries)Middle incomeMoldovaMongoliaMontenegroMoroccoMozambiqueMyanmarNamibiaNauruNepalNetherlandsNew ZealandNicaraguaNigerNigeriaNorth AmericaNorwayOECD membersOmanOther small statesPacific island small statesPakistanPalauPanamaPapua New GuineaParaguayPeruPhilippinesPolandPortugalPost-demographic dividendPre-demographic dividendPuerto RicoQatarRomaniaRussian FederationRwandaSamoaSan MarinoSao Tome and PrincipeSaudi ArabiaSenegalSerbiaSeychellesSierra LeoneSlovak RepublicSloveniaSmall statesSolomon IslandsSomaliaSouth AfricaSouth AsiaSouth Asia (IDA & IBRD)South SudanSpainSri LankaSt. Kitts and NevisSt. LuciaSt. Vincent and the GrenadinesSub-Saharan Africa Sub-Saharan Africa (excluding high income)Sub-Saharan Africa (IDA & IBRD countries)SudanSurinameSwazilandSwedenSwitzerlandSyrian Arab RepublicTajikistanTanzaniaThailandTimor-LesteTogoTongaTrinidad and TobagoTunisiaTurkeyTurkmenistanTuvaluUgandaUkraineUnited Arab EmiratesUnited KingdomUnited StatesUpper middle incomeUruguayUzbekistanVanuatuVenezuela, RBVietnamWest Bank and GazaWorldYemen, Rep.Zimbabwe Timeline:
This timeline shows a graph from 1971 to 2015 of World. No data until 1970. Number of actual observations by date: 45.
Source name:
World Development Indicators
Source organization:
UNESCO Institute for Statistics
Categories, topics:
Education, Gender
Last updated:
apr 23, 2017
Indicators value changes by year
Minimum:
14.752
jan 1, 1973
Maximum:
43.744
jan 1, 2015
At the date of observation
Value
Absolute change
Change from previous value
jan 1, 1971
15.196
+15.196
0.0%
jan 1, 1972
14.95
-0.246
-1.62%
jan 1, 1973
14.752
-0.198
-1.32%
jan 1, 1974
14.786
+0.033
0.23%
jan 1, 1975
15.055
+0.269
1.82%
jan 1, 1976
15.652
+0.597
3.96%
jan 1, 1977
17.353
+1.701
10.87%
jan 1, 1978
20.286
+2.933
16.9%
jan 1, 1979
19.118
-1.168
-5.76%
jan 1, 1980
19.322
+0.204
1.06%
jan 1, 1981
20.278
+0.957
4.95%
jan 1, 1982
21.639
+1.36
6.71%
jan 1, 1983
21.99
+0.351
1.62%
jan 1, 1984
22.912
+0.922
4.19%
jan 1, 1985
23.807
+0.895
3.9%
jan 1, 1986
24.681
+0.875
3.67%
jan 1, 1987
26.085
+1.403
5.68%
jan 1, 1988
27.242
+1.158
4.44%
jan 1, 1989
27.709
+0.467
1.71%
jan 1, 1990
27.607
-0.102
-0.37%
jan 1, 1991
27.529
-0.078
-0.28%
jan 1, 1992
27.63
+0.101
0.37%
jan 1, 1993
27.783
+0.153
0.55%
jan 1, 1994
27.857
+0.074
0.27%
jan 1, 1995
27.727
-0.13
-0.47%
jan 1, 1996
28.122
+0.395
1.42%
jan 1, 1997
28.61
+0.489
1.74%
jan 1, 1998
28.85
+0.239
0.84%
jan 1, 1999
29.265
+0.415
1.44%
jan 1, 2000
29.258
-0.006
-0.02%
jan 1, 2001
29.472
+0.214
0.73%
jan 1, 2002
29.782
+0.31
1.05%
jan 1, 2003
30.003
+0.22
0.74%
jan 1, 2004
30.571
+0.568
1.89%
jan 1, 2005
31.197
+0.626
2.05%
jan 1, 2006
32.259
+1.063
3.41%
jan 1, 2007
34.16
+1.9
5.89%
jan 1, 2008
34.616
+0.456
1.34%
jan 1, 2009
35.648
+1.032
2.98%
jan 1, 2010
36.045
+0.397
1.11%
jan 1, 2011
37.179
+1.134
3.15%
jan 1, 2012
39.015
+1.836
4.94%
jan 1, 2013
41.371
+2.356
6.04%
jan 1, 2014
43.024
+1.653
3.99%
jan 1, 2015
43.744
+0.72
1.67%
Ranking of countries by current statistics by years


Comments: