29
/
en
AIzaSyAYiBZKx7MnpbEhh9jyipgxe19OcubqV5w
April 1, 2024
29899
Euro area
EMU
false
2
1
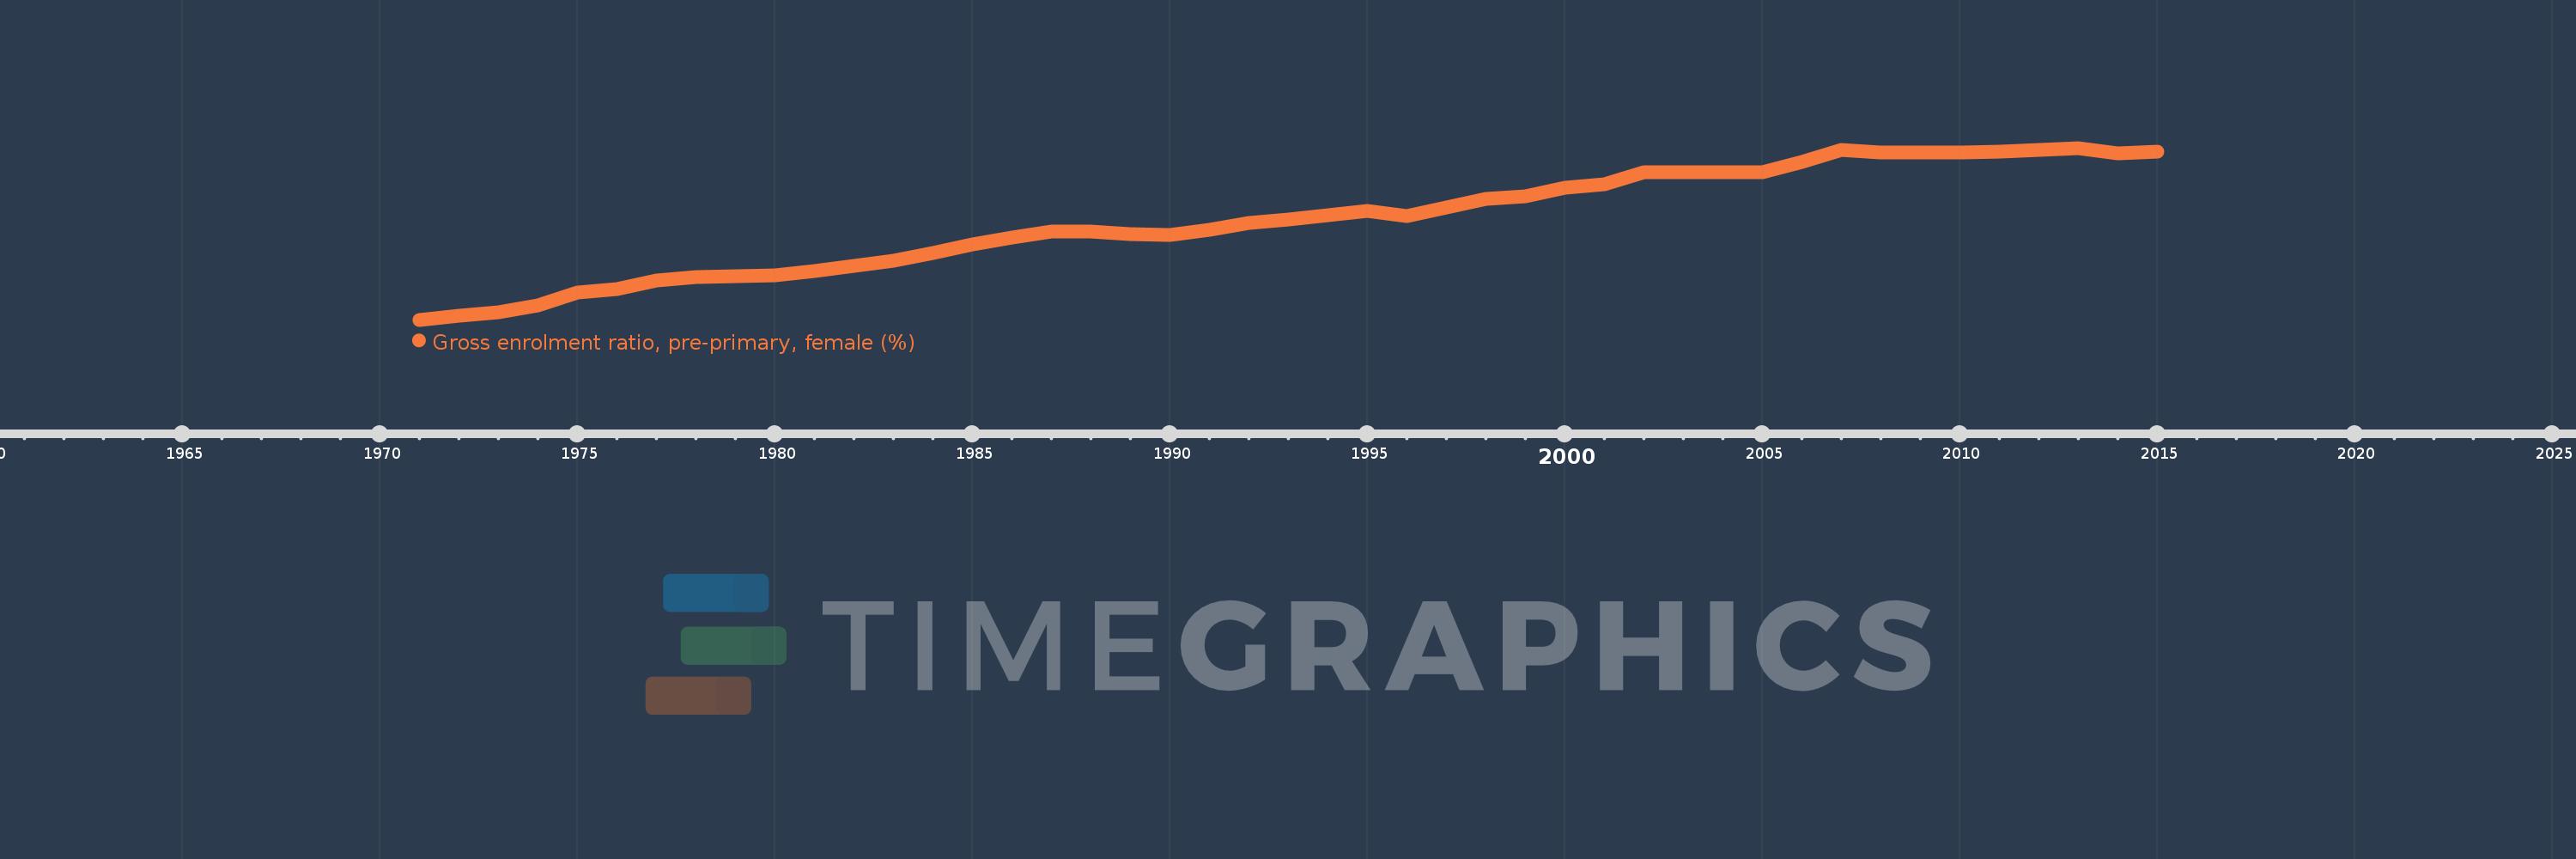
Gross enrolment ratio, pre-primary, female (%)
2015,2014,2013,2012,2011,2010,2009,2008,2007,2006,2005,2004,2003,2002,2001,2000,1999,1998,1997,1996,1995,1994,1993,1992,1991,1990,1989,1988,1987,1986,1985,1984,1983,1982,1981,1980,1979,1978,1977,1976,1975,1974,1973,1972,1971
This statistics in other country:
AfghanistanAlbaniaAlgeriaAndorraAngolaAntigua and BarbudaArab WorldArgentinaArmeniaArubaAustraliaAustriaAzerbaijanBahamas, TheBahrainBangladeshBarbadosBelarusBelgiumBelizeBeninBermudaBhutanBoliviaBosnia and HerzegovinaBotswanaBrazilBrunei DarussalamBulgariaBurkina FasoBurundiCabo VerdeCambodiaCameroonCanadaCaribbean small statesCentral African RepublicCentral Europe and the BalticsChadChileChinaColombiaComorosCongo, Dem. Rep.Congo, Rep.Costa RicaCote d'IvoireCroatiaCubaCyprusCzech RepublicDenmarkDjiboutiDominicaDominican RepublicEarly-demographic dividendEast Asia & PacificEast Asia & Pacific (excluding high income)East Asia & Pacific (IDA & IBRD countries)EcuadorEgypt, Arab Rep.El SalvadorEquatorial GuineaEritreaEstoniaEthiopiaEuro areaEurope & Central AsiaEurope & Central Asia (excluding high income)Europe & Central Asia (IDA & IBRD countries)European UnionFijiFinlandFragile and conflict affected situationsFranceGabonGambia, TheGeorgiaGermanyGhanaGreeceGrenadaGuatemalaGuineaGuinea-BissauGuyanaHeavily indebted poor countries (HIPC)High incomeHondurasHong Kong SAR, ChinaHungaryIBRD onlyIcelandIDA & IBRD totalIDA blendIDA onlyIDA totalIndiaIndonesiaIran, Islamic Rep.IraqIrelandIsraelItalyJamaicaJapanJordanKazakhstanKenyaKorea, Dem. People’s Rep.Korea, Rep.KuwaitKyrgyz RepublicLao PDRLate-demographic dividendLatin America & Caribbean Latin America & Caribbean (excluding high income)Latin America & the Caribbean (IDA & IBRD countries)LatviaLeast developed countries: UN classificationLebanonLesothoLiberiaLibyaLiechtensteinLithuaniaLow & middle incomeLow incomeLower middle incomeLuxembourgMacao SAR, ChinaMacedonia, FYRMadagascarMaldivesMaliMaltaMarshall IslandsMauritaniaMauritiusMexicoMicronesia, Fed. Sts.Middle East & North AfricaMiddle East & North Africa (excluding high income)Middle East & North Africa (IDA & IBRD countries)Middle incomeMoldovaMongoliaMontenegroMoroccoMozambiqueMyanmarNamibiaNauruNepalNetherlandsNew ZealandNicaraguaNigerNigeriaNorth AmericaNorwayOECD membersOmanOther small statesPacific island small statesPakistanPalauPanamaPapua New GuineaParaguayPeruPhilippinesPolandPortugalPost-demographic dividendPre-demographic dividendPuerto RicoQatarRomaniaRussian FederationRwandaSamoaSan MarinoSao Tome and PrincipeSaudi ArabiaSenegalSerbiaSeychellesSierra LeoneSlovak RepublicSloveniaSmall statesSolomon IslandsSomaliaSouth AfricaSouth AsiaSouth Asia (IDA & IBRD)South SudanSpainSri LankaSt. Kitts and NevisSt. LuciaSt. Vincent and the GrenadinesSub-Saharan Africa Sub-Saharan Africa (excluding high income)Sub-Saharan Africa (IDA & IBRD countries)SudanSurinameSwazilandSwedenSwitzerlandSyrian Arab RepublicTajikistanTanzaniaThailandTimor-LesteTogoTongaTrinidad and TobagoTunisiaTurkeyTurkmenistanTuvaluUgandaUkraineUnited Arab EmiratesUnited KingdomUnited StatesUpper middle incomeUruguayUzbekistanVanuatuVenezuela, RBVietnamWest Bank and GazaWorldYemen, Rep.Zimbabwe Timeline:
This timeline shows a graph from 1971 to 2015 of Euro area. No data until 1970. Number of actual observations by date: 45.
Source name:
World Development Indicators
Source organization:
UNESCO Institute for Statistics
Categories, topics:
Education, Gender
Last updated:
apr 23, 2017
Indicators value changes by year
Minimum:
68.422
jan 1, 1971
Maximum:
103.084
jan 1, 2013
At the date of observation
Value
Absolute change
Change from previous value
jan 1, 1971
68.422
+68.422
0.0%
jan 1, 1972
69.189
+0.767
1.12%
jan 1, 1973
69.914
+0.725
1.05%
jan 1, 1974
71.298
+1.384
1.98%
jan 1, 1975
73.895
+2.597
3.64%
jan 1, 1976
74.636
+0.741
1.0%
jan 1, 1977
76.366
+1.73
2.32%
jan 1, 1978
76.985
+0.619
0.81%
jan 1, 1979
77.219
+0.234
0.3%
jan 1, 1980
77.387
+0.169
0.22%
jan 1, 1981
78.295
+0.908
1.17%
jan 1, 1982
79.239
+0.944
1.21%
jan 1, 1983
80.35
+1.111
1.4%
jan 1, 1984
81.923
+1.572
1.96%
jan 1, 1985
83.7
+1.777
2.17%
jan 1, 1986
84.938
+1.238
1.48%
jan 1, 1987
86.139
+1.202
1.41%
jan 1, 1988
86.234
+0.095
0.11%
jan 1, 1989
85.747
-0.487
-0.56%
jan 1, 1990
85.444
-0.304
-0.35%
jan 1, 1991
86.583
+1.139
1.33%
jan 1, 1992
87.942
+1.359
1.57%
jan 1, 1993
88.631
+0.689
0.78%
jan 1, 1994
89.473
+0.842
0.95%
jan 1, 1995
90.407
+0.934
1.04%
jan 1, 1996
89.272
-1.135
-1.26%
jan 1, 1997
90.993
+1.722
1.93%
jan 1, 1998
92.749
+1.756
1.93%
jan 1, 1999
93.401
+0.652
0.7%
jan 1, 2000
95.117
+1.716
1.84%
jan 1, 2001
95.698
+0.581
0.61%
jan 1, 2002
98.144
+2.447
2.56%
jan 1, 2003
98.142
-0.002
0.0%
jan 1, 2004
98.095
-0.048
-0.05%
jan 1, 2005
98.107
+0.012
0.01%
jan 1, 2006
100.207
+2.1
2.14%
jan 1, 2007
102.734
+2.527
2.52%
jan 1, 2008
102.176
-0.558
-0.54%
jan 1, 2009
102.137
-0.039
-0.04%
jan 1, 2010
102.121
-0.016
-0.02%
jan 1, 2011
102.395
+0.274
0.27%
jan 1, 2012
102.765
+0.369
0.36%
jan 1, 2013
103.084
+0.319
0.31%
jan 1, 2014
101.914
-1.17
-1.13%
jan 1, 2015
102.313
+0.399
0.39%
Ranking of countries by current statistics by years


Comments: