29
/
en
AIzaSyAYiBZKx7MnpbEhh9jyipgxe19OcubqV5w
April 1, 2024
119922
Djibouti
DJI
true
2
1
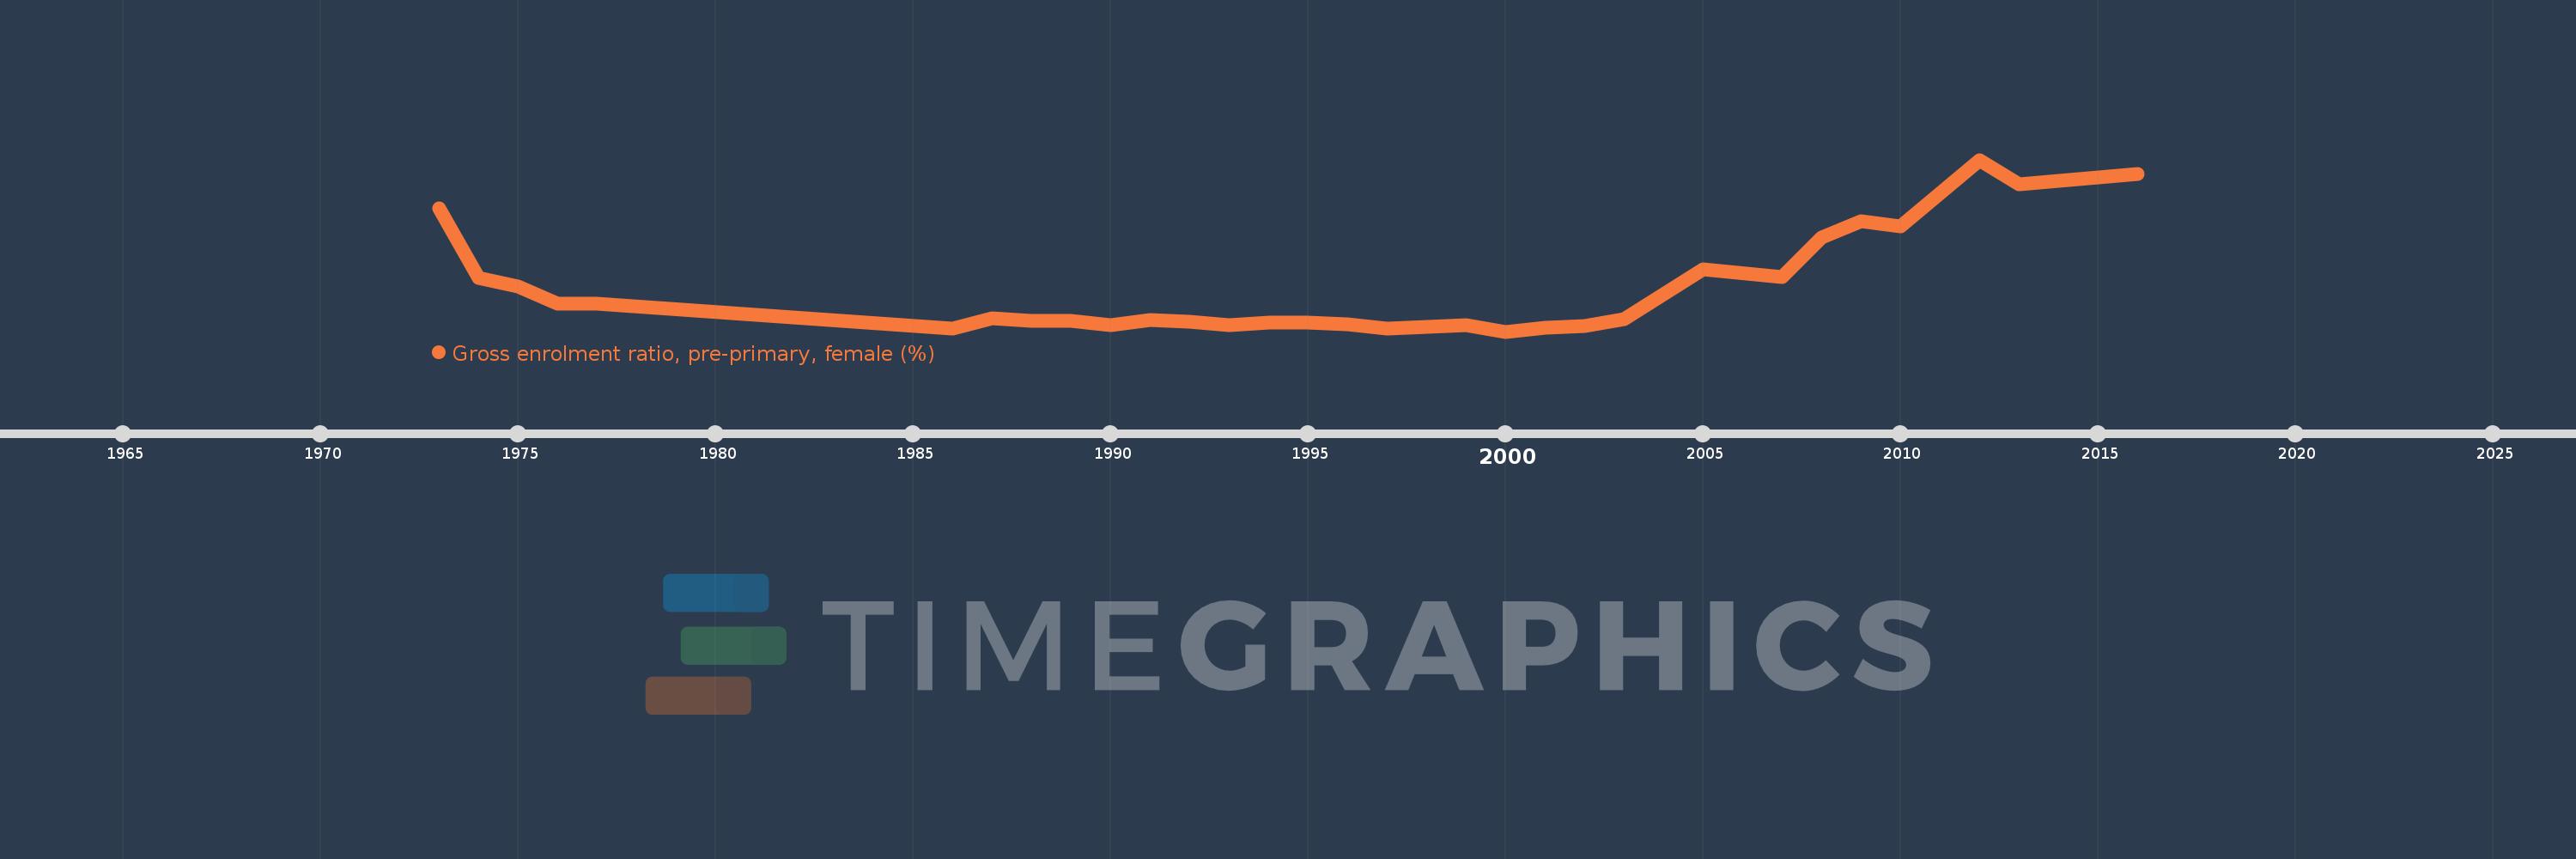
Gross enrolment ratio, pre-primary, female (%)
2016,2013,2012,2010,2009,2008,2007,2005,2003,2002,2001,2000,1999,1998,1997,1996,1995,1994,1993,1992,1991,1990,1989,1988,1987,1986,1977,1976,1975,1974,1973
This statistics in other country:
AfghanistanAlbaniaAlgeriaAndorraAngolaAntigua and BarbudaArab WorldArgentinaArmeniaArubaAustraliaAustriaAzerbaijanBahamas, TheBahrainBangladeshBarbadosBelarusBelgiumBelizeBeninBermudaBhutanBoliviaBosnia and HerzegovinaBotswanaBrazilBrunei DarussalamBulgariaBurkina FasoBurundiCabo VerdeCambodiaCameroonCanadaCaribbean small statesCentral African RepublicCentral Europe and the BalticsChadChileChinaColombiaComorosCongo, Dem. Rep.Congo, Rep.Costa RicaCote d'IvoireCroatiaCubaCyprusCzech RepublicDenmarkDjiboutiDominicaDominican RepublicEarly-demographic dividendEast Asia & PacificEast Asia & Pacific (excluding high income)East Asia & Pacific (IDA & IBRD countries)EcuadorEgypt, Arab Rep.El SalvadorEquatorial GuineaEritreaEstoniaEthiopiaEuro areaEurope & Central AsiaEurope & Central Asia (excluding high income)Europe & Central Asia (IDA & IBRD countries)European UnionFijiFinlandFragile and conflict affected situationsFranceGabonGambia, TheGeorgiaGermanyGhanaGreeceGrenadaGuatemalaGuineaGuinea-BissauGuyanaHeavily indebted poor countries (HIPC)High incomeHondurasHong Kong SAR, ChinaHungaryIBRD onlyIcelandIDA & IBRD totalIDA blendIDA onlyIDA totalIndiaIndonesiaIran, Islamic Rep.IraqIrelandIsraelItalyJamaicaJapanJordanKazakhstanKenyaKorea, Dem. People’s Rep.Korea, Rep.KuwaitKyrgyz RepublicLao PDRLate-demographic dividendLatin America & Caribbean Latin America & Caribbean (excluding high income)Latin America & the Caribbean (IDA & IBRD countries)LatviaLeast developed countries: UN classificationLebanonLesothoLiberiaLibyaLiechtensteinLithuaniaLow & middle incomeLow incomeLower middle incomeLuxembourgMacao SAR, ChinaMacedonia, FYRMadagascarMaldivesMaliMaltaMarshall IslandsMauritaniaMauritiusMexicoMicronesia, Fed. Sts.Middle East & North AfricaMiddle East & North Africa (excluding high income)Middle East & North Africa (IDA & IBRD countries)Middle incomeMoldovaMongoliaMontenegroMoroccoMozambiqueMyanmarNamibiaNauruNepalNetherlandsNew ZealandNicaraguaNigerNigeriaNorth AmericaNorwayOECD membersOmanOther small statesPacific island small statesPakistanPalauPanamaPapua New GuineaParaguayPeruPhilippinesPolandPortugalPost-demographic dividendPre-demographic dividendPuerto RicoQatarRomaniaRussian FederationRwandaSamoaSan MarinoSao Tome and PrincipeSaudi ArabiaSenegalSerbiaSeychellesSierra LeoneSlovak RepublicSloveniaSmall statesSolomon IslandsSomaliaSouth AfricaSouth AsiaSouth Asia (IDA & IBRD)South SudanSpainSri LankaSt. Kitts and NevisSt. LuciaSt. Vincent and the GrenadinesSub-Saharan Africa Sub-Saharan Africa (excluding high income)Sub-Saharan Africa (IDA & IBRD countries)SudanSurinameSwazilandSwedenSwitzerlandSyrian Arab RepublicTajikistanTanzaniaThailandTimor-LesteTogoTongaTrinidad and TobagoTunisiaTurkeyTurkmenistanTuvaluUgandaUkraineUnited Arab EmiratesUnited KingdomUnited StatesUpper middle incomeUruguayUzbekistanVanuatuVenezuela, RBVietnamWest Bank and GazaWorldYemen, Rep.Zimbabwe Timeline:
This timeline shows a graph from 1973 to 2016 of Djibouti. No data until 1972. Number of actual observations by date: 31.
Source name:
World Development Indicators
Source organization:
UNESCO Institute for Statistics
Categories, topics:
Education, Gender
Last updated:
apr 23, 2017
Indicators value changes by year
At the date of observation
Value
Absolute change
Change from previous value
jan 1, 1973
3.566
+3.566
0.0%
jan 1, 1974
1.839
-1.728
-48.44%
jan 1, 1975
1.616
-0.223
-12.11%
jan 1, 1976
1.202
-0.414
-25.64%
jan 1, 1977
1.197
-0.005
-0.4%
jan 1, 1986
0.582
-0.615
-51.34%
jan 1, 1987
0.83
+0.248
42.58%
jan 1, 1988
0.769
-0.061
-7.34%
jan 1, 1989
0.759
-0.011
-1.4%
jan 1, 1990
0.654
-0.105
-13.82%
jan 1, 1991
0.789
+0.135
20.66%
jan 1, 1992
0.745
-0.044
-5.52%
jan 1, 1993
0.659
-0.086
-11.54%
jan 1, 1994
0.712
+0.053
8.02%
jan 1, 1995
0.712
0.0
-0.04%
jan 1, 1996
0.681
-0.031
-4.39%
jan 1, 1997
0.569
-0.111
-16.34%
jan 1, 1998
0.614
+0.045
7.89%
jan 1, 1999
0.664
+0.05
8.11%
jan 1, 2000
0.497
-0.167
-25.18%
jan 1, 2001
0.589
+0.092
18.46%
jan 1, 2002
0.628
+0.04
6.72%
jan 1, 2003
0.804
+0.176
27.98%
jan 1, 2005
2.056
+1.252
155.74%
jan 1, 2007
1.853
-0.203
-9.89%
jan 1, 2008
2.832
+0.979
52.84%
jan 1, 2009
3.237
+0.405
14.29%
jan 1, 2010
3.114
-0.122
-3.78%
jan 1, 2012
4.771
+1.657
53.21%
jan 1, 2013
4.155
-0.617
-12.92%
jan 1, 2016
4.409
+0.255
6.13%
Ranking of countries by current statistics by years


Comments: