29
/
en
AIzaSyAYiBZKx7MnpbEhh9jyipgxe19OcubqV5w
April 1, 2024
141861
Greece
GRC
true
2
1
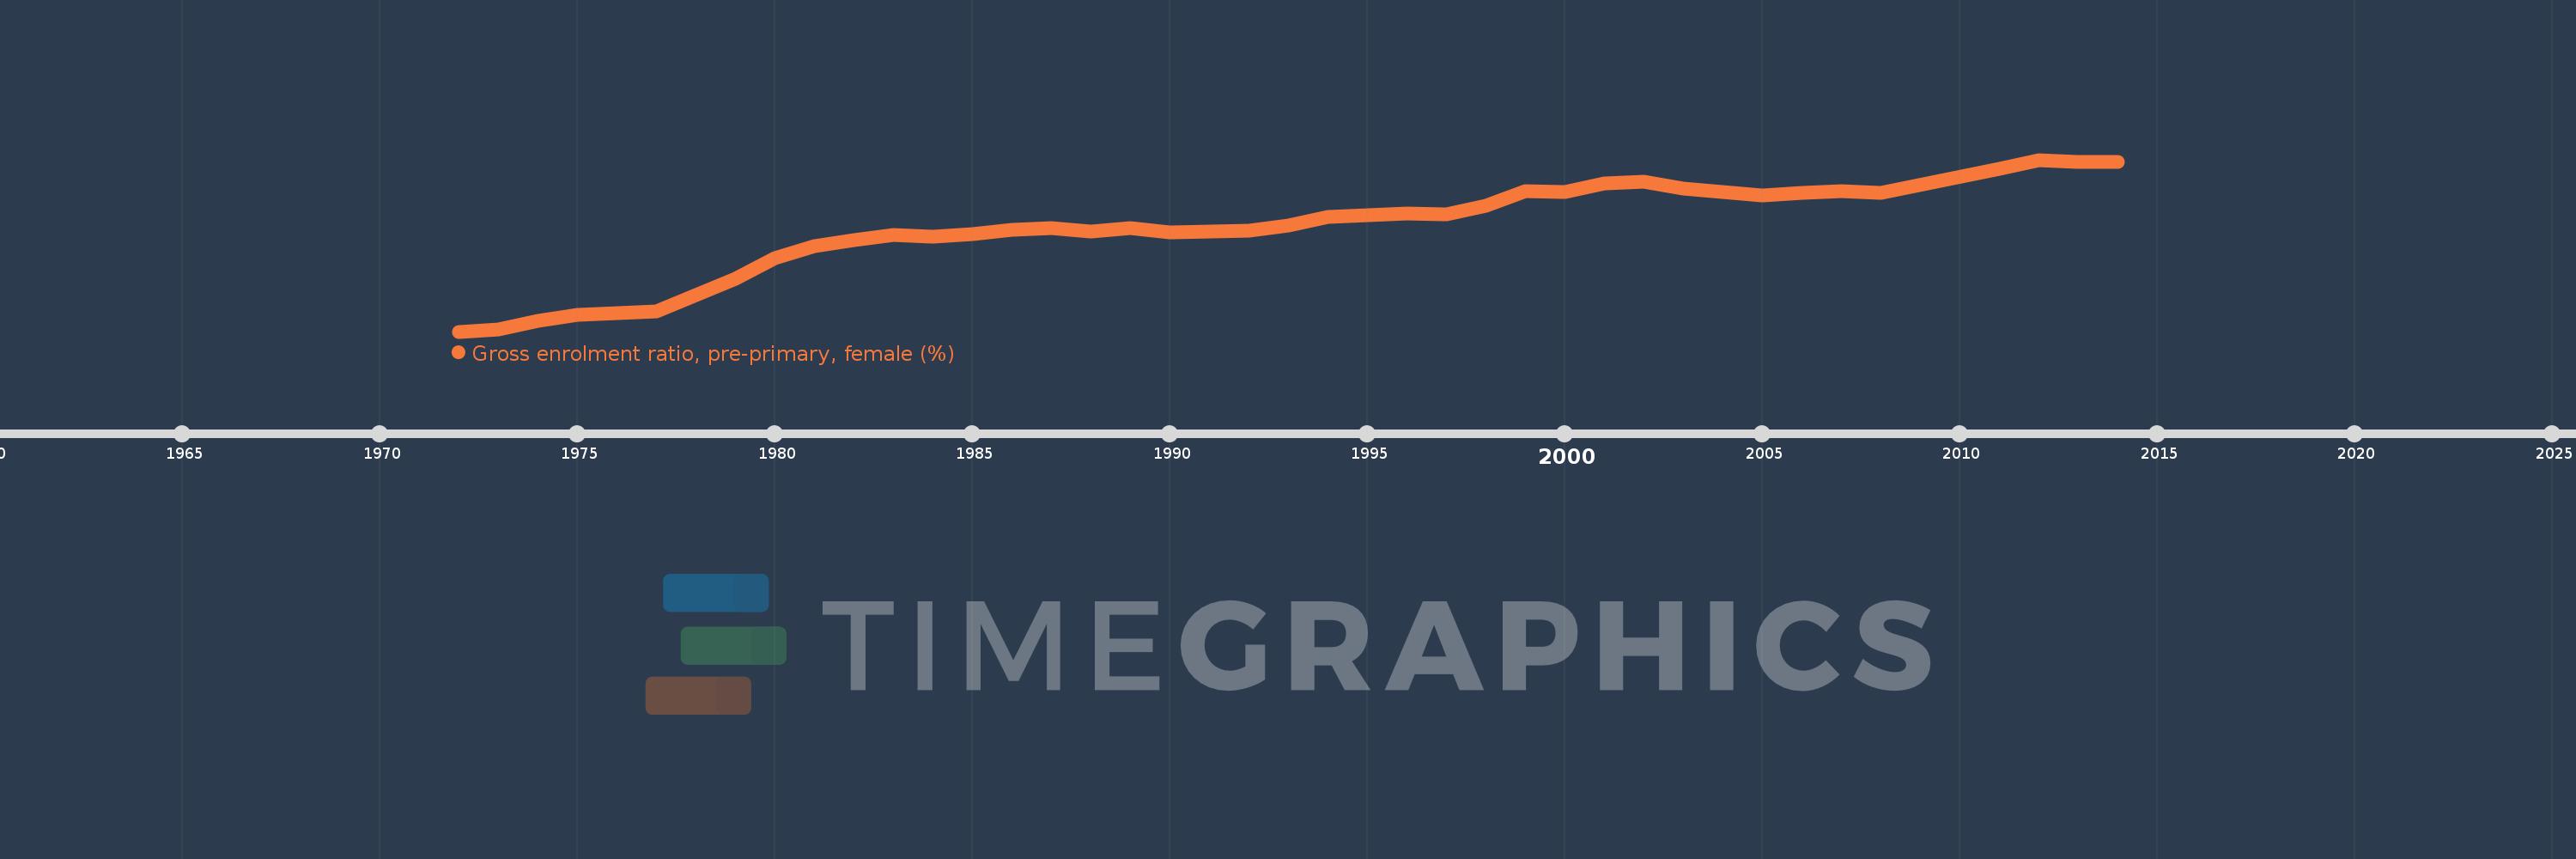
Gross enrolment ratio, pre-primary, female (%)
2014,2013,2012,2011,2008,2007,2006,2005,2004,2003,2002,2001,2000,1999,1998,1997,1996,1995,1994,1993,1992,1991,1990,1989,1988,1987,1986,1985,1984,1983,1982,1981,1980,1979,1978,1977,1976,1975,1974,1973,1972
This statistics in other country:
AfghanistanAlbaniaAlgeriaAndorraAngolaAntigua and BarbudaArab WorldArgentinaArmeniaArubaAustraliaAustriaAzerbaijanBahamas, TheBahrainBangladeshBarbadosBelarusBelgiumBelizeBeninBermudaBhutanBoliviaBosnia and HerzegovinaBotswanaBrazilBrunei DarussalamBulgariaBurkina FasoBurundiCabo VerdeCambodiaCameroonCanadaCaribbean small statesCentral African RepublicCentral Europe and the BalticsChadChileChinaColombiaComorosCongo, Dem. Rep.Congo, Rep.Costa RicaCote d'IvoireCroatiaCubaCyprusCzech RepublicDenmarkDjiboutiDominicaDominican RepublicEarly-demographic dividendEast Asia & PacificEast Asia & Pacific (excluding high income)East Asia & Pacific (IDA & IBRD countries)EcuadorEgypt, Arab Rep.El SalvadorEquatorial GuineaEritreaEstoniaEthiopiaEuro areaEurope & Central AsiaEurope & Central Asia (excluding high income)Europe & Central Asia (IDA & IBRD countries)European UnionFijiFinlandFragile and conflict affected situationsFranceGabonGambia, TheGeorgiaGermanyGhanaGreeceGrenadaGuatemalaGuineaGuinea-BissauGuyanaHeavily indebted poor countries (HIPC)High incomeHondurasHong Kong SAR, ChinaHungaryIBRD onlyIcelandIDA & IBRD totalIDA blendIDA onlyIDA totalIndiaIndonesiaIran, Islamic Rep.IraqIrelandIsraelItalyJamaicaJapanJordanKazakhstanKenyaKorea, Dem. People’s Rep.Korea, Rep.KuwaitKyrgyz RepublicLao PDRLate-demographic dividendLatin America & Caribbean Latin America & Caribbean (excluding high income)Latin America & the Caribbean (IDA & IBRD countries)LatviaLeast developed countries: UN classificationLebanonLesothoLiberiaLibyaLiechtensteinLithuaniaLow & middle incomeLow incomeLower middle incomeLuxembourgMacao SAR, ChinaMacedonia, FYRMadagascarMaldivesMaliMaltaMarshall IslandsMauritaniaMauritiusMexicoMicronesia, Fed. Sts.Middle East & North AfricaMiddle East & North Africa (excluding high income)Middle East & North Africa (IDA & IBRD countries)Middle incomeMoldovaMongoliaMontenegroMoroccoMozambiqueMyanmarNamibiaNauruNepalNetherlandsNew ZealandNicaraguaNigerNigeriaNorth AmericaNorwayOECD membersOmanOther small statesPacific island small statesPakistanPalauPanamaPapua New GuineaParaguayPeruPhilippinesPolandPortugalPost-demographic dividendPre-demographic dividendPuerto RicoQatarRomaniaRussian FederationRwandaSamoaSan MarinoSao Tome and PrincipeSaudi ArabiaSenegalSerbiaSeychellesSierra LeoneSlovak RepublicSloveniaSmall statesSolomon IslandsSomaliaSouth AfricaSouth AsiaSouth Asia (IDA & IBRD)South SudanSpainSri LankaSt. Kitts and NevisSt. LuciaSt. Vincent and the GrenadinesSub-Saharan Africa Sub-Saharan Africa (excluding high income)Sub-Saharan Africa (IDA & IBRD countries)SudanSurinameSwazilandSwedenSwitzerlandSyrian Arab RepublicTajikistanTanzaniaThailandTimor-LesteTogoTongaTrinidad and TobagoTunisiaTurkeyTurkmenistanTuvaluUgandaUkraineUnited Arab EmiratesUnited KingdomUnited StatesUpper middle incomeUruguayUzbekistanVanuatuVenezuela, RBVietnamWest Bank and GazaWorldYemen, Rep.Zimbabwe Timeline:
This timeline shows a graph from 1972 to 2014 of Greece. No data until 1971. Number of actual observations by date: 41.
Source name:
World Development Indicators
Source organization:
UNESCO Institute for Statistics
Categories, topics:
Education, Gender
Last updated:
apr 23, 2017
Indicators value changes by year
Maximum:
76.249
jan 1, 2012
At the date of observation
Value
Absolute change
Change from previous value
jan 1, 1972
30.61
+30.61
0.0%
jan 1, 1973
31.068
+0.458
1.5%
jan 1, 1974
33.497
+2.429
7.82%
jan 1, 1975
35.123
+1.626
4.85%
jan 1, 1976
35.53
+0.407
1.16%
jan 1, 1977
35.945
+0.415
1.17%
jan 1, 1978
40.346
+4.401
12.24%
jan 1, 1979
44.698
+4.353
10.79%
jan 1, 1980
50.216
+5.518
12.34%
jan 1, 1981
53.425
+3.209
6.39%
jan 1, 1982
54.812
+1.388
2.6%
jan 1, 1983
56.195
+1.383
2.52%
jan 1, 1984
55.916
-0.279
-0.5%
jan 1, 1985
56.584
+0.668
1.19%
jan 1, 1986
57.578
+0.994
1.76%
jan 1, 1987
58.05
+0.472
0.82%
jan 1, 1988
57.134
-0.916
-1.58%
jan 1, 1989
58.193
+1.06
1.85%
jan 1, 1990
57.076
-1.117
-1.92%
jan 1, 1991
57.163
+0.087
0.15%
jan 1, 1992
57.468
+0.305
0.53%
jan 1, 1993
58.874
+1.406
2.45%
jan 1, 1994
61.081
+2.207
3.75%
jan 1, 1995
61.484
+0.403
0.66%
jan 1, 1996
61.991
+0.507
0.82%
jan 1, 1997
61.701
-0.29
-0.47%
jan 1, 1998
63.937
+2.236
3.62%
jan 1, 1999
67.894
+3.957
6.19%
jan 1, 2000
67.691
-0.203
-0.3%
jan 1, 2001
70.065
+2.374
3.51%
jan 1, 2002
70.407
+0.342
0.49%
jan 1, 2003
68.686
-1.721
-2.44%
jan 1, 2004
67.608
-1.078
-1.57%
jan 1, 2005
66.706
-0.902
-1.33%
jan 1, 2006
67.423
+0.717
1.08%
jan 1, 2007
68.01
+0.587
0.87%
jan 1, 2008
67.567
-0.443
-0.65%
jan 1, 2011
73.876
+6.309
9.34%
jan 1, 2012
76.249
+2.373
3.21%
jan 1, 2013
75.759
-0.49
-0.64%
jan 1, 2014
75.611
-0.149
-0.2%
Ranking of countries by current statistics by years


Comments: