29
/
en
AIzaSyAYiBZKx7MnpbEhh9jyipgxe19OcubqV5w
April 1, 2024
124853
Egypt, Arab Rep.
EGY
true
2
1
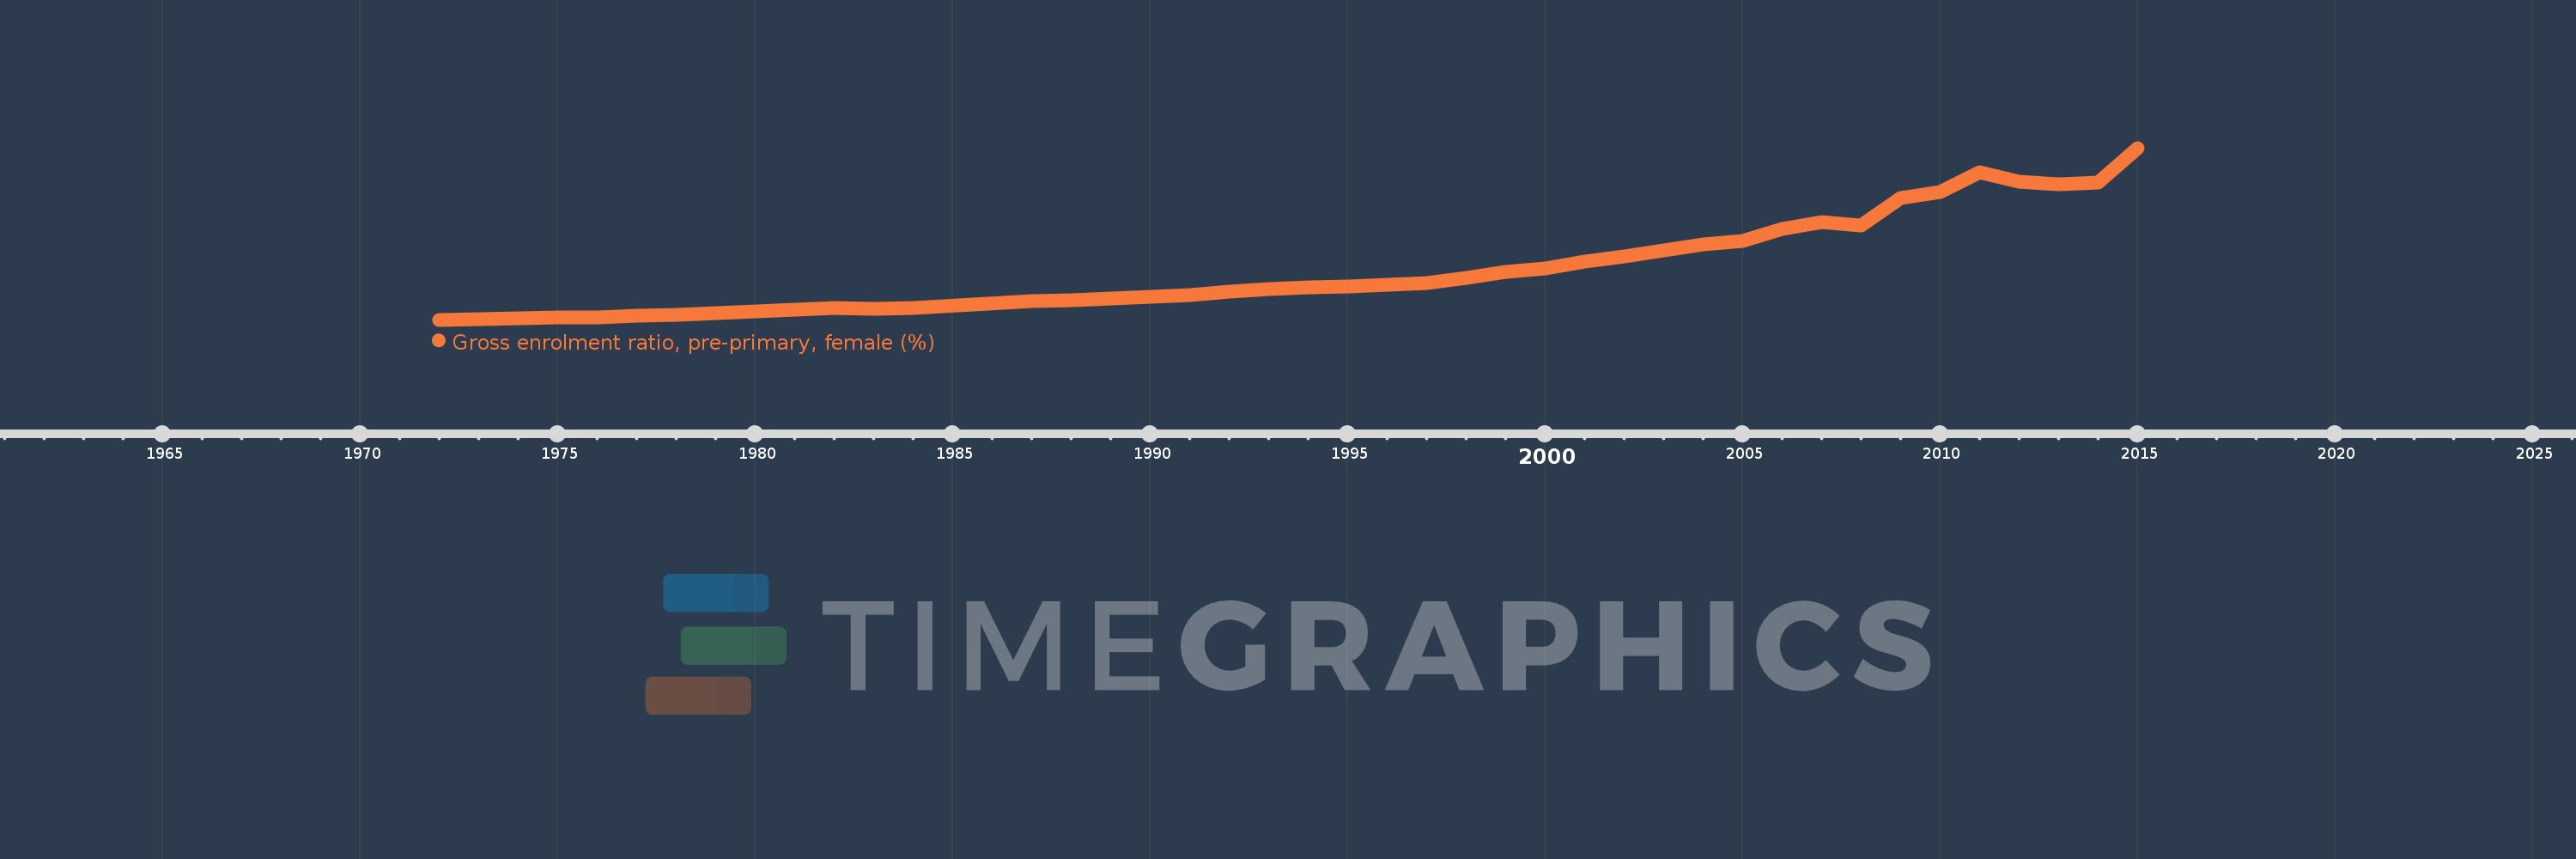
Gross enrolment ratio, pre-primary, female (%)
2015,2014,2013,2012,2011,2010,2009,2008,2007,2006,2005,2004,2003,2002,2001,2000,1999,1998,1997,1996,1995,1994,1993,1992,1991,1990,1989,1988,1987,1984,1983,1982,1981,1980,1978,1977,1976,1975,1974,1973,1972
This statistics in other country:
AfghanistanAlbaniaAlgeriaAndorraAngolaAntigua and BarbudaArab WorldArgentinaArmeniaArubaAustraliaAustriaAzerbaijanBahamas, TheBahrainBangladeshBarbadosBelarusBelgiumBelizeBeninBermudaBhutanBoliviaBosnia and HerzegovinaBotswanaBrazilBrunei DarussalamBulgariaBurkina FasoBurundiCabo VerdeCambodiaCameroonCanadaCaribbean small statesCentral African RepublicCentral Europe and the BalticsChadChileChinaColombiaComorosCongo, Dem. Rep.Congo, Rep.Costa RicaCote d'IvoireCroatiaCubaCyprusCzech RepublicDenmarkDjiboutiDominicaDominican RepublicEarly-demographic dividendEast Asia & PacificEast Asia & Pacific (excluding high income)East Asia & Pacific (IDA & IBRD countries)EcuadorEgypt, Arab Rep.El SalvadorEquatorial GuineaEritreaEstoniaEthiopiaEuro areaEurope & Central AsiaEurope & Central Asia (excluding high income)Europe & Central Asia (IDA & IBRD countries)European UnionFijiFinlandFragile and conflict affected situationsFranceGabonGambia, TheGeorgiaGermanyGhanaGreeceGrenadaGuatemalaGuineaGuinea-BissauGuyanaHeavily indebted poor countries (HIPC)High incomeHondurasHong Kong SAR, ChinaHungaryIBRD onlyIcelandIDA & IBRD totalIDA blendIDA onlyIDA totalIndiaIndonesiaIran, Islamic Rep.IraqIrelandIsraelItalyJamaicaJapanJordanKazakhstanKenyaKorea, Dem. People’s Rep.Korea, Rep.KuwaitKyrgyz RepublicLao PDRLate-demographic dividendLatin America & Caribbean Latin America & Caribbean (excluding high income)Latin America & the Caribbean (IDA & IBRD countries)LatviaLeast developed countries: UN classificationLebanonLesothoLiberiaLibyaLiechtensteinLithuaniaLow & middle incomeLow incomeLower middle incomeLuxembourgMacao SAR, ChinaMacedonia, FYRMadagascarMaldivesMaliMaltaMarshall IslandsMauritaniaMauritiusMexicoMicronesia, Fed. Sts.Middle East & North AfricaMiddle East & North Africa (excluding high income)Middle East & North Africa (IDA & IBRD countries)Middle incomeMoldovaMongoliaMontenegroMoroccoMozambiqueMyanmarNamibiaNauruNepalNetherlandsNew ZealandNicaraguaNigerNigeriaNorth AmericaNorwayOECD membersOmanOther small statesPacific island small statesPakistanPalauPanamaPapua New GuineaParaguayPeruPhilippinesPolandPortugalPost-demographic dividendPre-demographic dividendPuerto RicoQatarRomaniaRussian FederationRwandaSamoaSan MarinoSao Tome and PrincipeSaudi ArabiaSenegalSerbiaSeychellesSierra LeoneSlovak RepublicSloveniaSmall statesSolomon IslandsSomaliaSouth AfricaSouth AsiaSouth Asia (IDA & IBRD)South SudanSpainSri LankaSt. Kitts and NevisSt. LuciaSt. Vincent and the GrenadinesSub-Saharan Africa Sub-Saharan Africa (excluding high income)Sub-Saharan Africa (IDA & IBRD countries)SudanSurinameSwazilandSwedenSwitzerlandSyrian Arab RepublicTajikistanTanzaniaThailandTimor-LesteTogoTongaTrinidad and TobagoTunisiaTurkeyTurkmenistanTuvaluUgandaUkraineUnited Arab EmiratesUnited KingdomUnited StatesUpper middle incomeUruguayUzbekistanVanuatuVenezuela, RBVietnamWest Bank and GazaWorldYemen, Rep.Zimbabwe Timeline:
This timeline shows a graph from 1972 to 2015 of Egypt, Arab Rep.. No data until 1971. Number of actual observations by date: 41.
Source name:
World Development Indicators
Source organization:
UNESCO Institute for Statistics
Categories, topics:
Education, Gender
Last updated:
apr 23, 2017
Indicators value changes by year
Maximum:
30.024
jan 1, 2015
At the date of observation
Value
Absolute change
Change from previous value
jan 1, 1972
1.284
+1.284
0.0%
jan 1, 1973
1.352
+0.068
5.32%
jan 1, 1974
1.554
+0.202
14.9%
jan 1, 1975
1.706
+0.152
9.78%
jan 1, 1976
1.727
+0.022
1.27%
jan 1, 1977
1.985
+0.258
14.91%
jan 1, 1978
2.168
+0.184
9.25%
jan 1, 1980
2.697
+0.529
24.4%
jan 1, 1981
2.978
+0.281
10.42%
jan 1, 1982
3.206
+0.228
7.65%
jan 1, 1983
3.15
-0.057
-1.77%
jan 1, 1984
3.293
+0.144
4.56%
jan 1, 1987
4.453
+1.16
35.22%
jan 1, 1988
4.534
+0.081
1.82%
jan 1, 1989
4.903
+0.369
8.13%
jan 1, 1990
5.118
+0.215
4.37%
jan 1, 1991
5.402
+0.284
5.55%
jan 1, 1992
5.94
+0.538
9.97%
jan 1, 1993
6.484
+0.544
9.16%
jan 1, 1994
6.693
+0.209
3.23%
jan 1, 1995
6.86
+0.166
2.48%
jan 1, 1996
7.163
+0.304
4.43%
jan 1, 1997
7.45
+0.287
4.01%
jan 1, 1998
8.248
+0.798
10.71%
jan 1, 1999
9.274
+1.026
12.44%
jan 1, 2000
9.883
+0.61
6.58%
jan 1, 2001
10.944
+1.06
10.73%
jan 1, 2002
11.905
+0.961
8.78%
jan 1, 2003
12.869
+0.964
8.1%
jan 1, 2004
13.883
+1.014
7.88%
jan 1, 2005
14.502
+0.619
4.46%
jan 1, 2006
16.517
+2.015
13.89%
jan 1, 2007
17.655
+1.138
6.89%
jan 1, 2008
17.044
-0.611
-3.46%
jan 1, 2009
21.615
+4.571
26.82%
jan 1, 2010
22.67
+1.055
4.88%
jan 1, 2011
25.909
+3.239
14.29%
jan 1, 2012
24.388
-1.52
-5.87%
jan 1, 2013
24.011
-0.377
-1.55%
jan 1, 2014
24.18
+0.168
0.7%
jan 1, 2015
30.024
+5.844
24.17%
Ranking of countries by current statistics by years


Comments: