29
/
en
AIzaSyAYiBZKx7MnpbEhh9jyipgxe19OcubqV5w
April 1, 2024
115843
Cuba
CUB
true
2
1
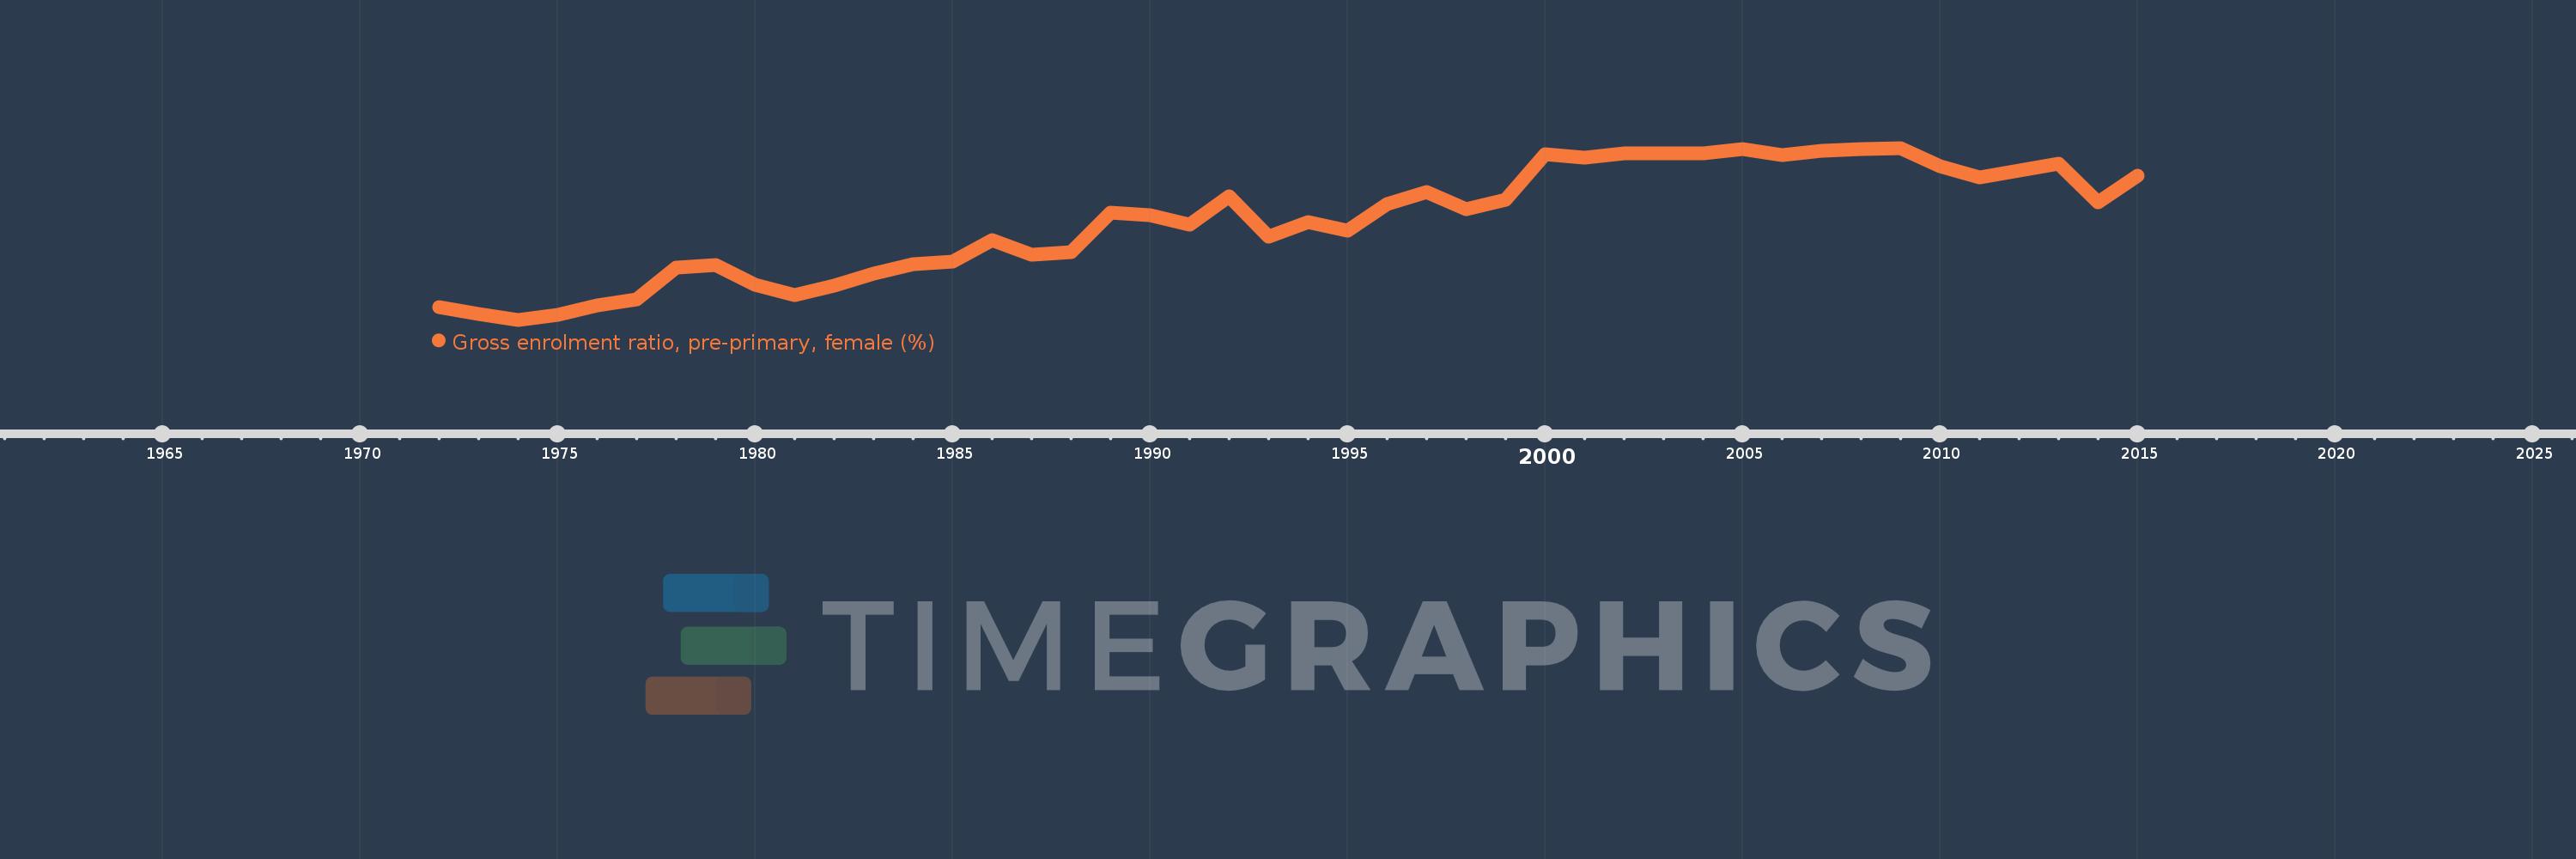
Gross enrolment ratio, pre-primary, female (%)
2015,2014,2013,2012,2011,2010,2009,2008,2007,2006,2005,2004,2003,2002,2001,2000,1999,1998,1997,1996,1995,1994,1993,1992,1991,1990,1989,1988,1987,1986,1985,1984,1983,1982,1981,1980,1979,1978,1977,1976,1975,1974,1973,1972
This statistics in other country:
AfghanistanAlbaniaAlgeriaAndorraAngolaAntigua and BarbudaArab WorldArgentinaArmeniaArubaAustraliaAustriaAzerbaijanBahamas, TheBahrainBangladeshBarbadosBelarusBelgiumBelizeBeninBermudaBhutanBoliviaBosnia and HerzegovinaBotswanaBrazilBrunei DarussalamBulgariaBurkina FasoBurundiCabo VerdeCambodiaCameroonCanadaCaribbean small statesCentral African RepublicCentral Europe and the BalticsChadChileChinaColombiaComorosCongo, Dem. Rep.Congo, Rep.Costa RicaCote d'IvoireCroatiaCubaCyprusCzech RepublicDenmarkDjiboutiDominicaDominican RepublicEarly-demographic dividendEast Asia & PacificEast Asia & Pacific (excluding high income)East Asia & Pacific (IDA & IBRD countries)EcuadorEgypt, Arab Rep.El SalvadorEquatorial GuineaEritreaEstoniaEthiopiaEuro areaEurope & Central AsiaEurope & Central Asia (excluding high income)Europe & Central Asia (IDA & IBRD countries)European UnionFijiFinlandFragile and conflict affected situationsFranceGabonGambia, TheGeorgiaGermanyGhanaGreeceGrenadaGuatemalaGuineaGuinea-BissauGuyanaHeavily indebted poor countries (HIPC)High incomeHondurasHong Kong SAR, ChinaHungaryIBRD onlyIcelandIDA & IBRD totalIDA blendIDA onlyIDA totalIndiaIndonesiaIran, Islamic Rep.IraqIrelandIsraelItalyJamaicaJapanJordanKazakhstanKenyaKorea, Dem. People’s Rep.Korea, Rep.KuwaitKyrgyz RepublicLao PDRLate-demographic dividendLatin America & Caribbean Latin America & Caribbean (excluding high income)Latin America & the Caribbean (IDA & IBRD countries)LatviaLeast developed countries: UN classificationLebanonLesothoLiberiaLibyaLiechtensteinLithuaniaLow & middle incomeLow incomeLower middle incomeLuxembourgMacao SAR, ChinaMacedonia, FYRMadagascarMaldivesMaliMaltaMarshall IslandsMauritaniaMauritiusMexicoMicronesia, Fed. Sts.Middle East & North AfricaMiddle East & North Africa (excluding high income)Middle East & North Africa (IDA & IBRD countries)Middle incomeMoldovaMongoliaMontenegroMoroccoMozambiqueMyanmarNamibiaNauruNepalNetherlandsNew ZealandNicaraguaNigerNigeriaNorth AmericaNorwayOECD membersOmanOther small statesPacific island small statesPakistanPalauPanamaPapua New GuineaParaguayPeruPhilippinesPolandPortugalPost-demographic dividendPre-demographic dividendPuerto RicoQatarRomaniaRussian FederationRwandaSamoaSan MarinoSao Tome and PrincipeSaudi ArabiaSenegalSerbiaSeychellesSierra LeoneSlovak RepublicSloveniaSmall statesSolomon IslandsSomaliaSouth AfricaSouth AsiaSouth Asia (IDA & IBRD)South SudanSpainSri LankaSt. Kitts and NevisSt. LuciaSt. Vincent and the GrenadinesSub-Saharan Africa Sub-Saharan Africa (excluding high income)Sub-Saharan Africa (IDA & IBRD countries)SudanSurinameSwazilandSwedenSwitzerlandSyrian Arab RepublicTajikistanTanzaniaThailandTimor-LesteTogoTongaTrinidad and TobagoTunisiaTurkeyTurkmenistanTuvaluUgandaUkraineUnited Arab EmiratesUnited KingdomUnited StatesUpper middle incomeUruguayUzbekistanVanuatuVenezuela, RBVietnamWest Bank and GazaWorldYemen, Rep.Zimbabwe Timeline:
This timeline shows a graph from 1972 to 2015 of Cuba. No data until 1971. Number of actual observations by date: 44.
Source name:
World Development Indicators
Source organization:
UNESCO Institute for Statistics
Categories, topics:
Education, Gender
Last updated:
apr 23, 2017
Indicators value changes by year
Maximum:
108.703
jan 1, 2009
At the date of observation
Value
Absolute change
Change from previous value
jan 1, 1972
51.469
+51.469
0.0%
jan 1, 1973
48.962
-2.507
-4.87%
jan 1, 1974
46.83
-2.132
-4.35%
jan 1, 1975
48.604
+1.774
3.79%
jan 1, 1976
51.914
+3.31
6.81%
jan 1, 1977
54.107
+2.193
4.22%
jan 1, 1978
65.53
+11.423
21.11%
jan 1, 1979
66.543
+1.013
1.55%
jan 1, 1980
59.422
-7.121
-10.7%
jan 1, 1981
55.793
-3.628
-6.11%
jan 1, 1982
59.172
+3.379
6.06%
jan 1, 1983
63.46
+4.288
7.25%
jan 1, 1984
66.708
+3.247
5.12%
jan 1, 1985
67.703
+0.995
1.49%
jan 1, 1986
75.413
+7.71
11.39%
jan 1, 1987
70.234
-5.179
-6.87%
jan 1, 1988
71.083
+0.849
1.21%
jan 1, 1989
85.529
+14.446
20.32%
jan 1, 1990
84.434
-1.095
-1.28%
jan 1, 1991
80.937
-3.496
-4.14%
jan 1, 1992
91.281
+10.343
12.78%
jan 1, 1993
76.865
-14.415
-15.79%
jan 1, 1994
81.988
+5.123
6.66%
jan 1, 1995
78.98
-3.008
-3.67%
jan 1, 1996
88.476
+9.495
12.02%
jan 1, 1997
92.841
+4.365
4.93%
jan 1, 1998
86.533
-6.307
-6.79%
jan 1, 1999
89.97
+3.437
3.97%
jan 1, 2000
106.544
+16.574
18.42%
jan 1, 2001
105.152
-1.392
-1.31%
jan 1, 2002
106.627
+1.475
1.4%
jan 1, 2003
106.604
-0.023
-0.02%
jan 1, 2004
106.659
+0.055
0.05%
jan 1, 2005
108.16
+1.501
1.41%
jan 1, 2006
106.277
-1.883
-1.74%
jan 1, 2007
107.833
+1.556
1.46%
jan 1, 2008
108.221
+0.388
0.36%
jan 1, 2009
108.703
+0.481
0.44%
jan 1, 2010
102.188
-6.515
-5.99%
jan 1, 2011
98.032
-4.156
-4.07%
jan 1, 2012
100.417
+2.384
2.43%
jan 1, 2013
102.995
+2.578
2.57%
jan 1, 2014
89.074
-13.921
-13.52%
jan 1, 2015
98.62
+9.546
10.72%
Ranking of countries by current statistics by years


Comments: