29
/
en
AIzaSyAYiBZKx7MnpbEhh9jyipgxe19OcubqV5w
April 1, 2024
56263
Small states
SST
false
2
1
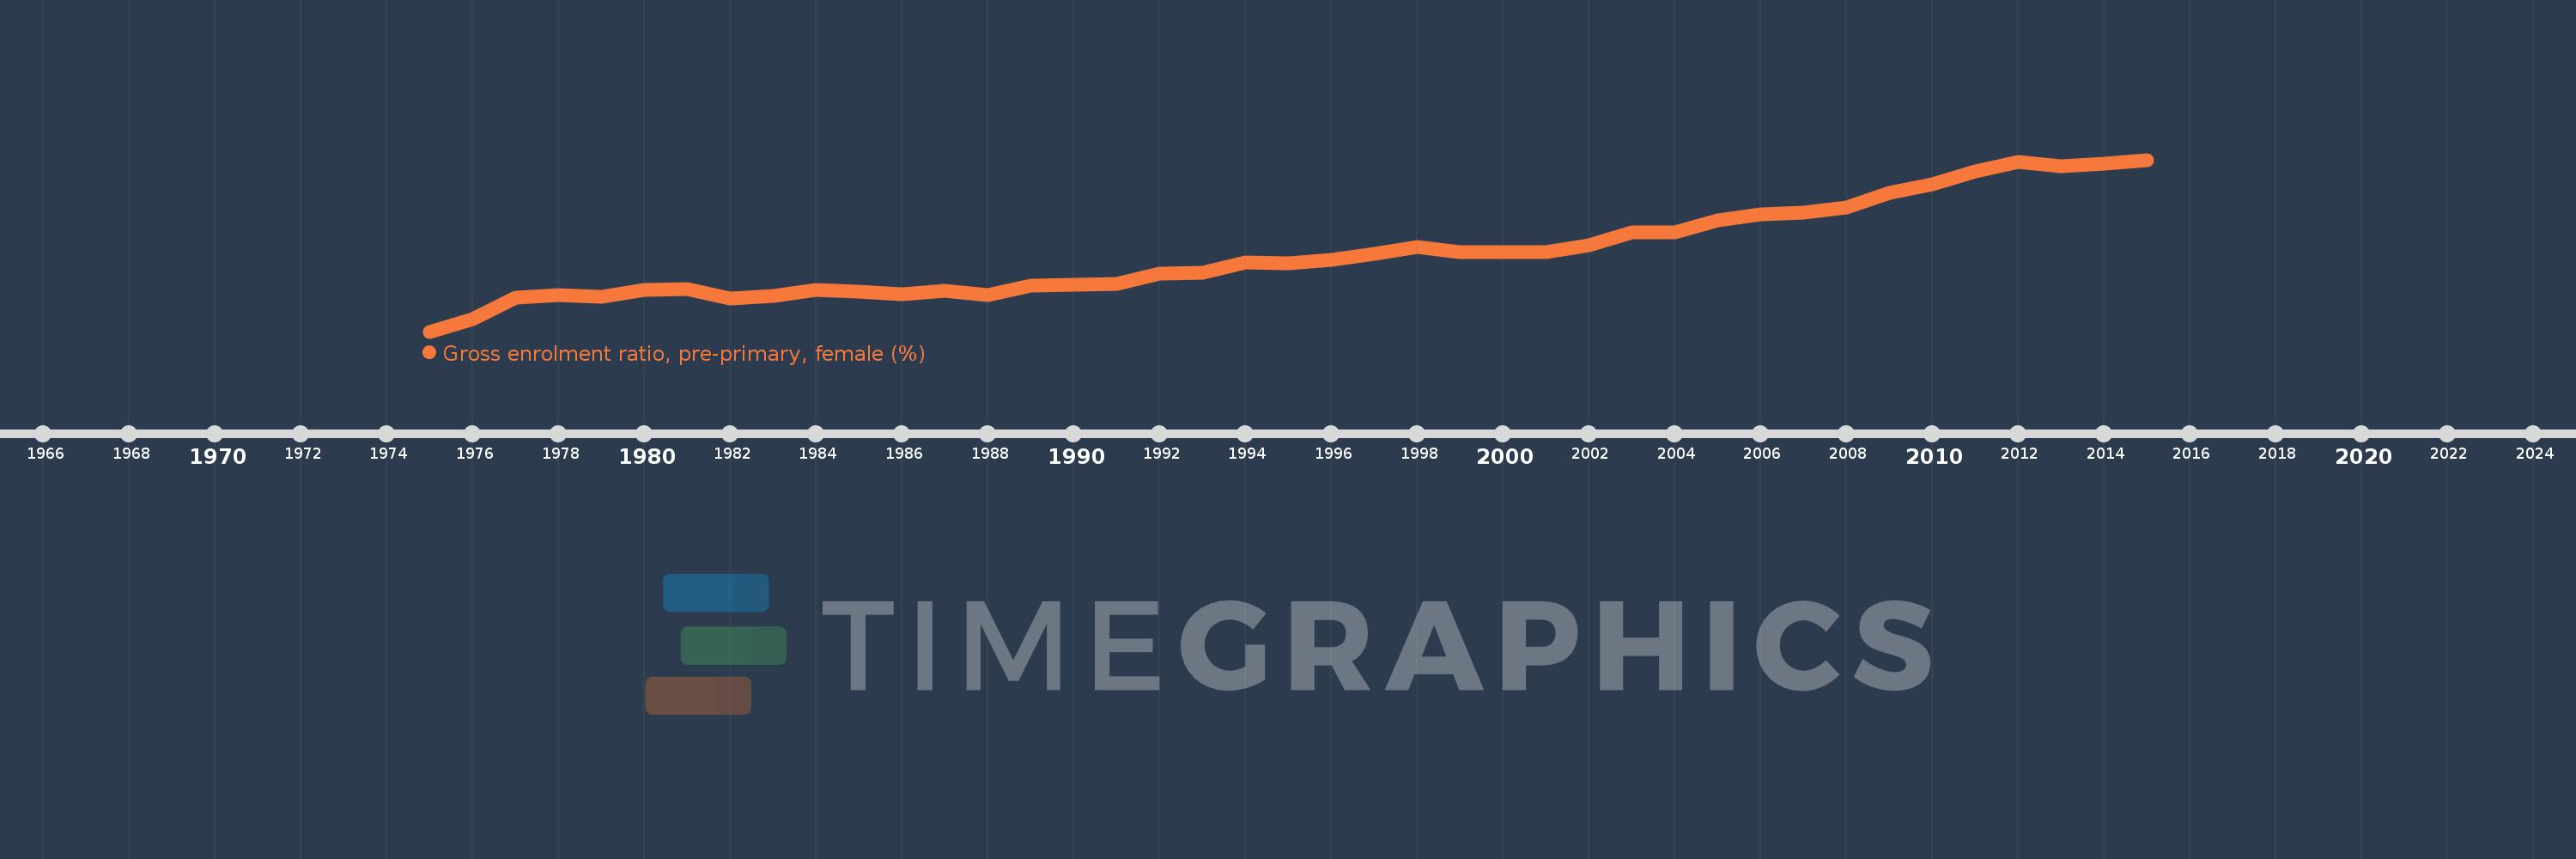
Gross enrolment ratio, pre-primary, female (%)
2015,2014,2013,2012,2011,2010,2009,2008,2007,2006,2005,2004,2003,2002,2001,2000,1999,1998,1997,1996,1995,1994,1993,1992,1991,1990,1989,1988,1987,1986,1985,1984,1983,1982,1981,1980,1979,1978,1977,1976,1975
This statistics in other country:
AfghanistanAlbaniaAlgeriaAndorraAngolaAntigua and BarbudaArab WorldArgentinaArmeniaArubaAustraliaAustriaAzerbaijanBahamas, TheBahrainBangladeshBarbadosBelarusBelgiumBelizeBeninBermudaBhutanBoliviaBosnia and HerzegovinaBotswanaBrazilBrunei DarussalamBulgariaBurkina FasoBurundiCabo VerdeCambodiaCameroonCanadaCaribbean small statesCentral African RepublicCentral Europe and the BalticsChadChileChinaColombiaComorosCongo, Dem. Rep.Congo, Rep.Costa RicaCote d'IvoireCroatiaCubaCyprusCzech RepublicDenmarkDjiboutiDominicaDominican RepublicEarly-demographic dividendEast Asia & PacificEast Asia & Pacific (excluding high income)East Asia & Pacific (IDA & IBRD countries)EcuadorEgypt, Arab Rep.El SalvadorEquatorial GuineaEritreaEstoniaEthiopiaEuro areaEurope & Central AsiaEurope & Central Asia (excluding high income)Europe & Central Asia (IDA & IBRD countries)European UnionFijiFinlandFragile and conflict affected situationsFranceGabonGambia, TheGeorgiaGermanyGhanaGreeceGrenadaGuatemalaGuineaGuinea-BissauGuyanaHeavily indebted poor countries (HIPC)High incomeHondurasHong Kong SAR, ChinaHungaryIBRD onlyIcelandIDA & IBRD totalIDA blendIDA onlyIDA totalIndiaIndonesiaIran, Islamic Rep.IraqIrelandIsraelItalyJamaicaJapanJordanKazakhstanKenyaKorea, Dem. People’s Rep.Korea, Rep.KuwaitKyrgyz RepublicLao PDRLate-demographic dividendLatin America & Caribbean Latin America & Caribbean (excluding high income)Latin America & the Caribbean (IDA & IBRD countries)LatviaLeast developed countries: UN classificationLebanonLesothoLiberiaLibyaLiechtensteinLithuaniaLow & middle incomeLow incomeLower middle incomeLuxembourgMacao SAR, ChinaMacedonia, FYRMadagascarMaldivesMaliMaltaMarshall IslandsMauritaniaMauritiusMexicoMicronesia, Fed. Sts.Middle East & North AfricaMiddle East & North Africa (excluding high income)Middle East & North Africa (IDA & IBRD countries)Middle incomeMoldovaMongoliaMontenegroMoroccoMozambiqueMyanmarNamibiaNauruNepalNetherlandsNew ZealandNicaraguaNigerNigeriaNorth AmericaNorwayOECD membersOmanOther small statesPacific island small statesPakistanPalauPanamaPapua New GuineaParaguayPeruPhilippinesPolandPortugalPost-demographic dividendPre-demographic dividendPuerto RicoQatarRomaniaRussian FederationRwandaSamoaSan MarinoSao Tome and PrincipeSaudi ArabiaSenegalSerbiaSeychellesSierra LeoneSlovak RepublicSloveniaSmall statesSolomon IslandsSomaliaSouth AfricaSouth AsiaSouth Asia (IDA & IBRD)South SudanSpainSri LankaSt. Kitts and NevisSt. LuciaSt. Vincent and the GrenadinesSub-Saharan Africa Sub-Saharan Africa (excluding high income)Sub-Saharan Africa (IDA & IBRD countries)SudanSurinameSwazilandSwedenSwitzerlandSyrian Arab RepublicTajikistanTanzaniaThailandTimor-LesteTogoTongaTrinidad and TobagoTunisiaTurkeyTurkmenistanTuvaluUgandaUkraineUnited Arab EmiratesUnited KingdomUnited StatesUpper middle incomeUruguayUzbekistanVanuatuVenezuela, RBVietnamWest Bank and GazaWorldYemen, Rep.Zimbabwe Timeline:
This timeline shows a graph from 1975 to 2015 of Small states. No data until 1974. Number of actual observations by date: 41.
Source name:
World Development Indicators
Source organization:
UNESCO Institute for Statistics
Categories, topics:
Education, Gender
Last updated:
apr 23, 2017
Indicators value changes by year
Minimum:
26.484
jan 1, 1975
At the date of observation
Value
Absolute change
Change from previous value
jan 1, 1975
26.484
+26.484
0.0%
jan 1, 1976
27.847
+1.362
5.14%
jan 1, 1977
30.25
+2.404
8.63%
jan 1, 1978
30.536
+0.286
0.95%
jan 1, 1979
30.321
-0.215
-0.7%
jan 1, 1980
31.04
+0.719
2.37%
jan 1, 1981
31.116
+0.076
0.25%
jan 1, 1982
30.103
-1.013
-3.26%
jan 1, 1983
30.429
+0.326
1.08%
jan 1, 1984
31.086
+0.656
2.16%
jan 1, 1985
30.876
-0.21
-0.68%
jan 1, 1986
30.603
-0.273
-0.88%
jan 1, 1987
30.921
+0.318
1.04%
jan 1, 1988
30.474
-0.447
-1.44%
jan 1, 1989
31.539
+1.065
3.49%
jan 1, 1990
31.607
+0.068
0.22%
jan 1, 1991
31.706
+0.099
0.31%
jan 1, 1992
32.809
+1.103
3.48%
jan 1, 1993
32.983
+0.174
0.53%
jan 1, 1994
34.08
+1.097
3.33%
jan 1, 1995
33.965
-0.114
-0.34%
jan 1, 1996
34.329
+0.364
1.07%
jan 1, 1997
34.979
+0.649
1.89%
jan 1, 1998
35.818
+0.84
2.4%
jan 1, 1999
35.169
-0.649
-1.81%
jan 1, 2000
35.205
+0.036
0.1%
jan 1, 2001
35.237
+0.033
0.09%
jan 1, 2002
35.977
+0.74
2.1%
jan 1, 2003
37.422
+1.445
4.02%
jan 1, 2004
37.395
-0.026
-0.07%
jan 1, 2005
38.747
+1.352
3.61%
jan 1, 2006
39.407
+0.66
1.7%
jan 1, 2007
39.536
+0.129
0.33%
jan 1, 2008
40.166
+0.629
1.59%
jan 1, 2009
41.761
+1.596
3.97%
jan 1, 2010
42.688
+0.926
2.22%
jan 1, 2011
44.073
+1.385
3.24%
jan 1, 2012
45.13
+1.057
2.4%
jan 1, 2013
44.643
-0.486
-1.08%
jan 1, 2014
44.925
+0.282
0.63%
jan 1, 2015
45.36
+0.435
0.97%
Ranking of countries by current statistics by years


Comments: