29
/
en
AIzaSyAYiBZKx7MnpbEhh9jyipgxe19OcubqV5w
April 1, 2024
264656
Togo
TGO
true
2
1
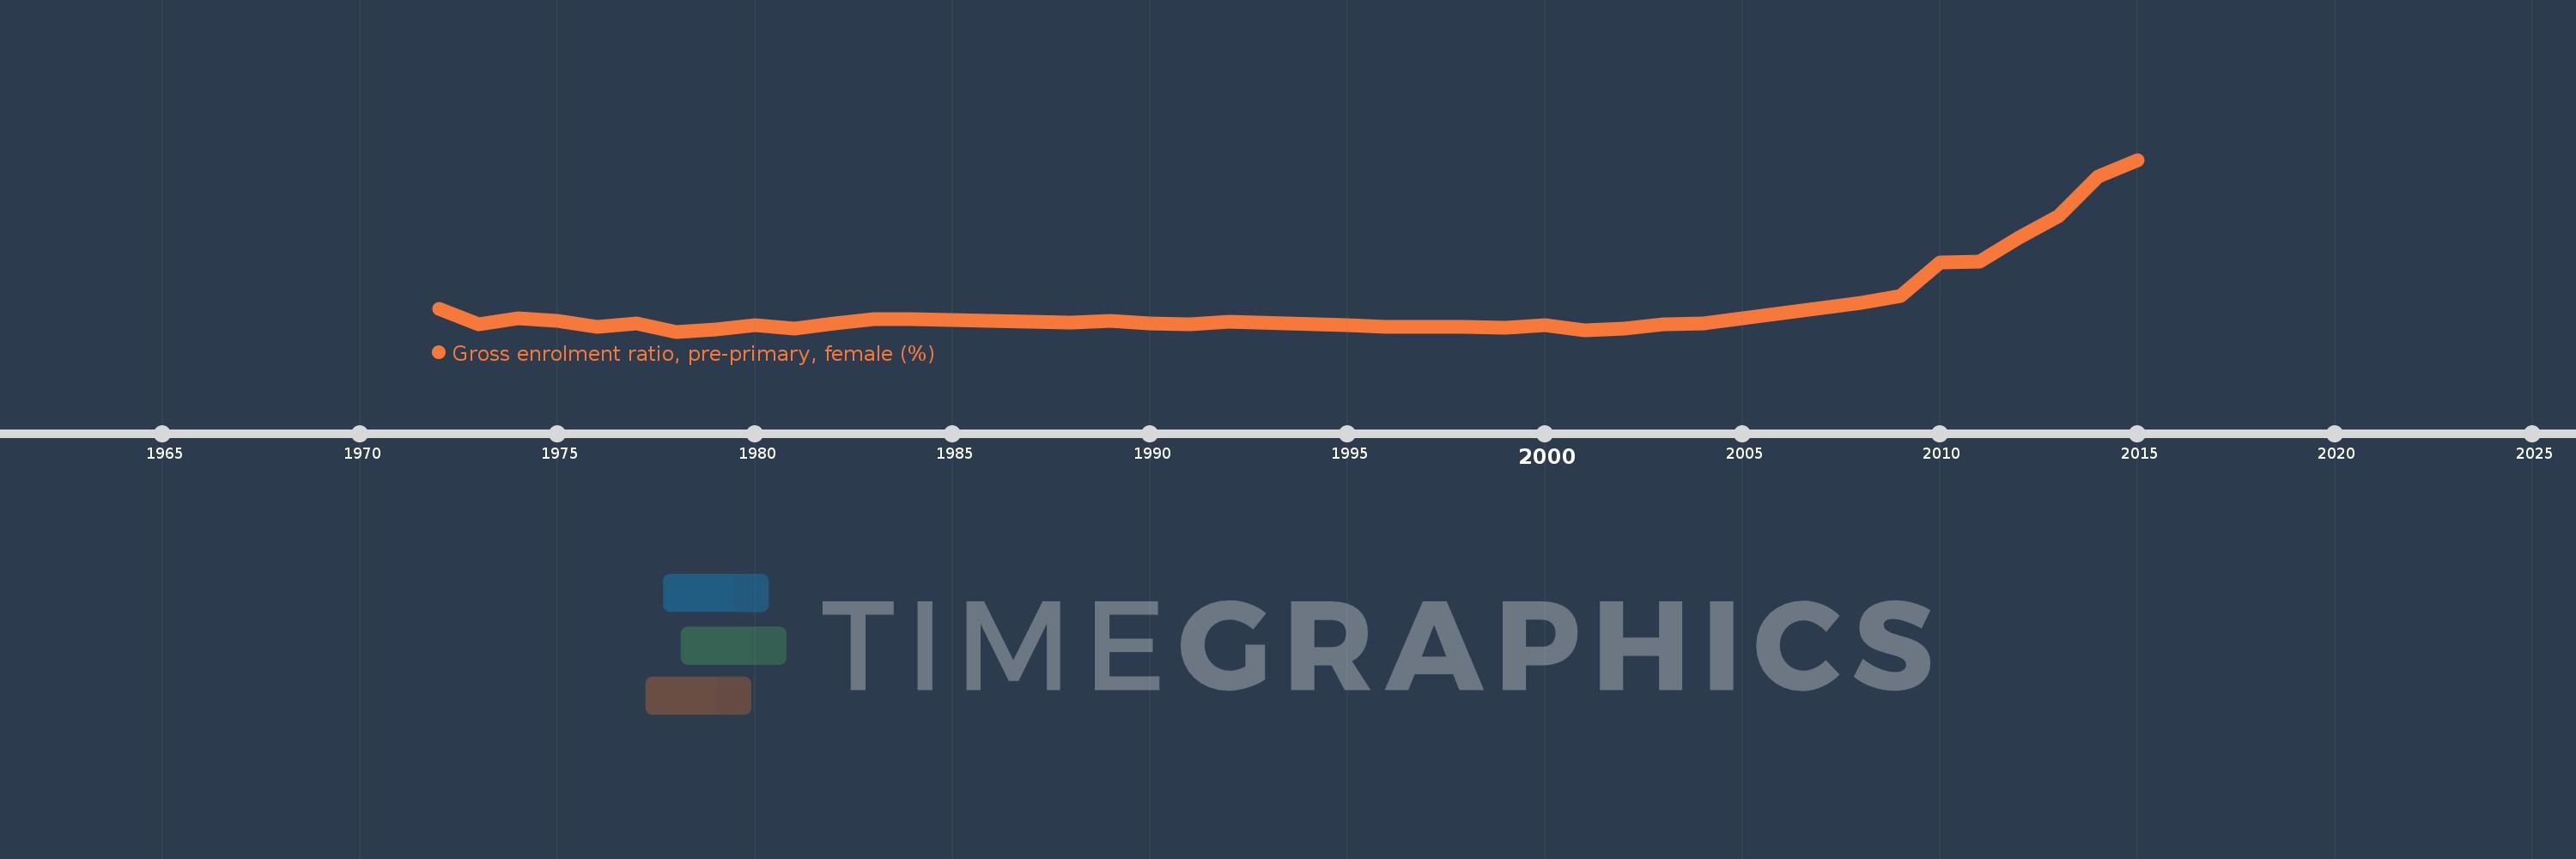
Gross enrolment ratio, pre-primary, female (%)
2015,2014,2013,2012,2011,2010,2009,2008,2007,2005,2004,2003,2002,2001,2000,1999,1998,1997,1996,1995,1992,1991,1990,1989,1988,1987,1986,1985,1984,1983,1982,1981,1980,1979,1978,1977,1976,1975,1974,1973,1972
This statistics in other country:
AfghanistanAlbaniaAlgeriaAndorraAngolaAntigua and BarbudaArab WorldArgentinaArmeniaArubaAustraliaAustriaAzerbaijanBahamas, TheBahrainBangladeshBarbadosBelarusBelgiumBelizeBeninBermudaBhutanBoliviaBosnia and HerzegovinaBotswanaBrazilBrunei DarussalamBulgariaBurkina FasoBurundiCabo VerdeCambodiaCameroonCanadaCaribbean small statesCentral African RepublicCentral Europe and the BalticsChadChileChinaColombiaComorosCongo, Dem. Rep.Congo, Rep.Costa RicaCote d'IvoireCroatiaCubaCyprusCzech RepublicDenmarkDjiboutiDominicaDominican RepublicEarly-demographic dividendEast Asia & PacificEast Asia & Pacific (excluding high income)East Asia & Pacific (IDA & IBRD countries)EcuadorEgypt, Arab Rep.El SalvadorEquatorial GuineaEritreaEstoniaEthiopiaEuro areaEurope & Central AsiaEurope & Central Asia (excluding high income)Europe & Central Asia (IDA & IBRD countries)European UnionFijiFinlandFragile and conflict affected situationsFranceGabonGambia, TheGeorgiaGermanyGhanaGreeceGrenadaGuatemalaGuineaGuinea-BissauGuyanaHeavily indebted poor countries (HIPC)High incomeHondurasHong Kong SAR, ChinaHungaryIBRD onlyIcelandIDA & IBRD totalIDA blendIDA onlyIDA totalIndiaIndonesiaIran, Islamic Rep.IraqIrelandIsraelItalyJamaicaJapanJordanKazakhstanKenyaKorea, Dem. People’s Rep.Korea, Rep.KuwaitKyrgyz RepublicLao PDRLate-demographic dividendLatin America & Caribbean Latin America & Caribbean (excluding high income)Latin America & the Caribbean (IDA & IBRD countries)LatviaLeast developed countries: UN classificationLebanonLesothoLiberiaLibyaLiechtensteinLithuaniaLow & middle incomeLow incomeLower middle incomeLuxembourgMacao SAR, ChinaMacedonia, FYRMadagascarMaldivesMaliMaltaMarshall IslandsMauritaniaMauritiusMexicoMicronesia, Fed. Sts.Middle East & North AfricaMiddle East & North Africa (excluding high income)Middle East & North Africa (IDA & IBRD countries)Middle incomeMoldovaMongoliaMontenegroMoroccoMozambiqueMyanmarNamibiaNauruNepalNetherlandsNew ZealandNicaraguaNigerNigeriaNorth AmericaNorwayOECD membersOmanOther small statesPacific island small statesPakistanPalauPanamaPapua New GuineaParaguayPeruPhilippinesPolandPortugalPost-demographic dividendPre-demographic dividendPuerto RicoQatarRomaniaRussian FederationRwandaSamoaSan MarinoSao Tome and PrincipeSaudi ArabiaSenegalSerbiaSeychellesSierra LeoneSlovak RepublicSloveniaSmall statesSolomon IslandsSomaliaSouth AfricaSouth AsiaSouth Asia (IDA & IBRD)South SudanSpainSri LankaSt. Kitts and NevisSt. LuciaSt. Vincent and the GrenadinesSub-Saharan Africa Sub-Saharan Africa (excluding high income)Sub-Saharan Africa (IDA & IBRD countries)SudanSurinameSwazilandSwedenSwitzerlandSyrian Arab RepublicTajikistanTanzaniaThailandTimor-LesteTogoTongaTrinidad and TobagoTunisiaTurkeyTurkmenistanTuvaluUgandaUkraineUnited Arab EmiratesUnited KingdomUnited StatesUpper middle incomeUruguayUzbekistanVanuatuVenezuela, RBVietnamWest Bank and GazaWorldYemen, Rep.Zimbabwe Timeline:
This timeline shows a graph from 1972 to 2015 of Togo. No data until 1971. Number of actual observations by date: 41.
Source name:
World Development Indicators
Source organization:
UNESCO Institute for Statistics
Categories, topics:
Education, Gender
Last updated:
apr 23, 2017
Indicators value changes by year
Maximum:
15.269
jan 1, 2015
At the date of observation
Value
Absolute change
Change from previous value
jan 1, 1972
3.78
+3.78
0.0%
jan 1, 1973
2.631
-1.149
-30.4%
jan 1, 1974
3.068
+0.437
16.61%
jan 1, 1975
2.896
-0.172
-5.6%
jan 1, 1976
2.394
-0.502
-17.32%
jan 1, 1977
2.66
+0.266
11.12%
jan 1, 1978
2.039
-0.622
-23.36%
jan 1, 1979
2.201
+0.162
7.95%
jan 1, 1980
2.522
+0.321
14.6%
jan 1, 1981
2.268
-0.255
-10.1%
jan 1, 1982
2.7
+0.433
19.09%
jan 1, 1983
2.992
+0.292
10.79%
jan 1, 1984
3.024
+0.032
1.08%
jan 1, 1985
2.899
-0.125
-4.13%
jan 1, 1986
2.847
-0.052
-1.8%
jan 1, 1987
2.819
-0.028
-1.0%
jan 1, 1988
2.734
-0.085
-3.01%
jan 1, 1989
2.859
+0.125
4.55%
jan 1, 1990
2.679
-0.18
-6.29%
jan 1, 1991
2.6
-0.078
-2.93%
jan 1, 1992
2.826
+0.226
8.69%
jan 1, 1995
2.549
-0.277
-9.81%
jan 1, 1996
2.376
-0.173
-6.79%
jan 1, 1997
2.402
+0.026
1.08%
jan 1, 1998
2.378
-0.024
-0.98%
jan 1, 1999
2.363
-0.015
-0.63%
jan 1, 2000
2.531
+0.168
7.1%
jan 1, 2001
2.147
-0.384
-15.16%
jan 1, 2002
2.279
+0.132
6.15%
jan 1, 2003
2.609
+0.33
14.46%
jan 1, 2004
2.636
+0.027
1.05%
jan 1, 2005
3.064
+0.428
16.23%
jan 1, 2007
3.86
+0.796
25.97%
jan 1, 2008
4.242
+0.382
9.9%
jan 1, 2009
4.784
+0.542
12.78%
jan 1, 2010
7.344
+2.56
53.5%
jan 1, 2011
7.423
+0.079
1.07%
jan 1, 2012
9.295
+1.872
25.22%
jan 1, 2013
10.904
+1.609
17.32%
jan 1, 2014
14.008
+3.103
28.46%
jan 1, 2015
15.269
+1.261
9.0%
Ranking of countries by current statistics by years


Comments: