29
/
en
AIzaSyAYiBZKx7MnpbEhh9jyipgxe19OcubqV5w
April 1, 2024
82732
Belize
BLZ
true
2
1
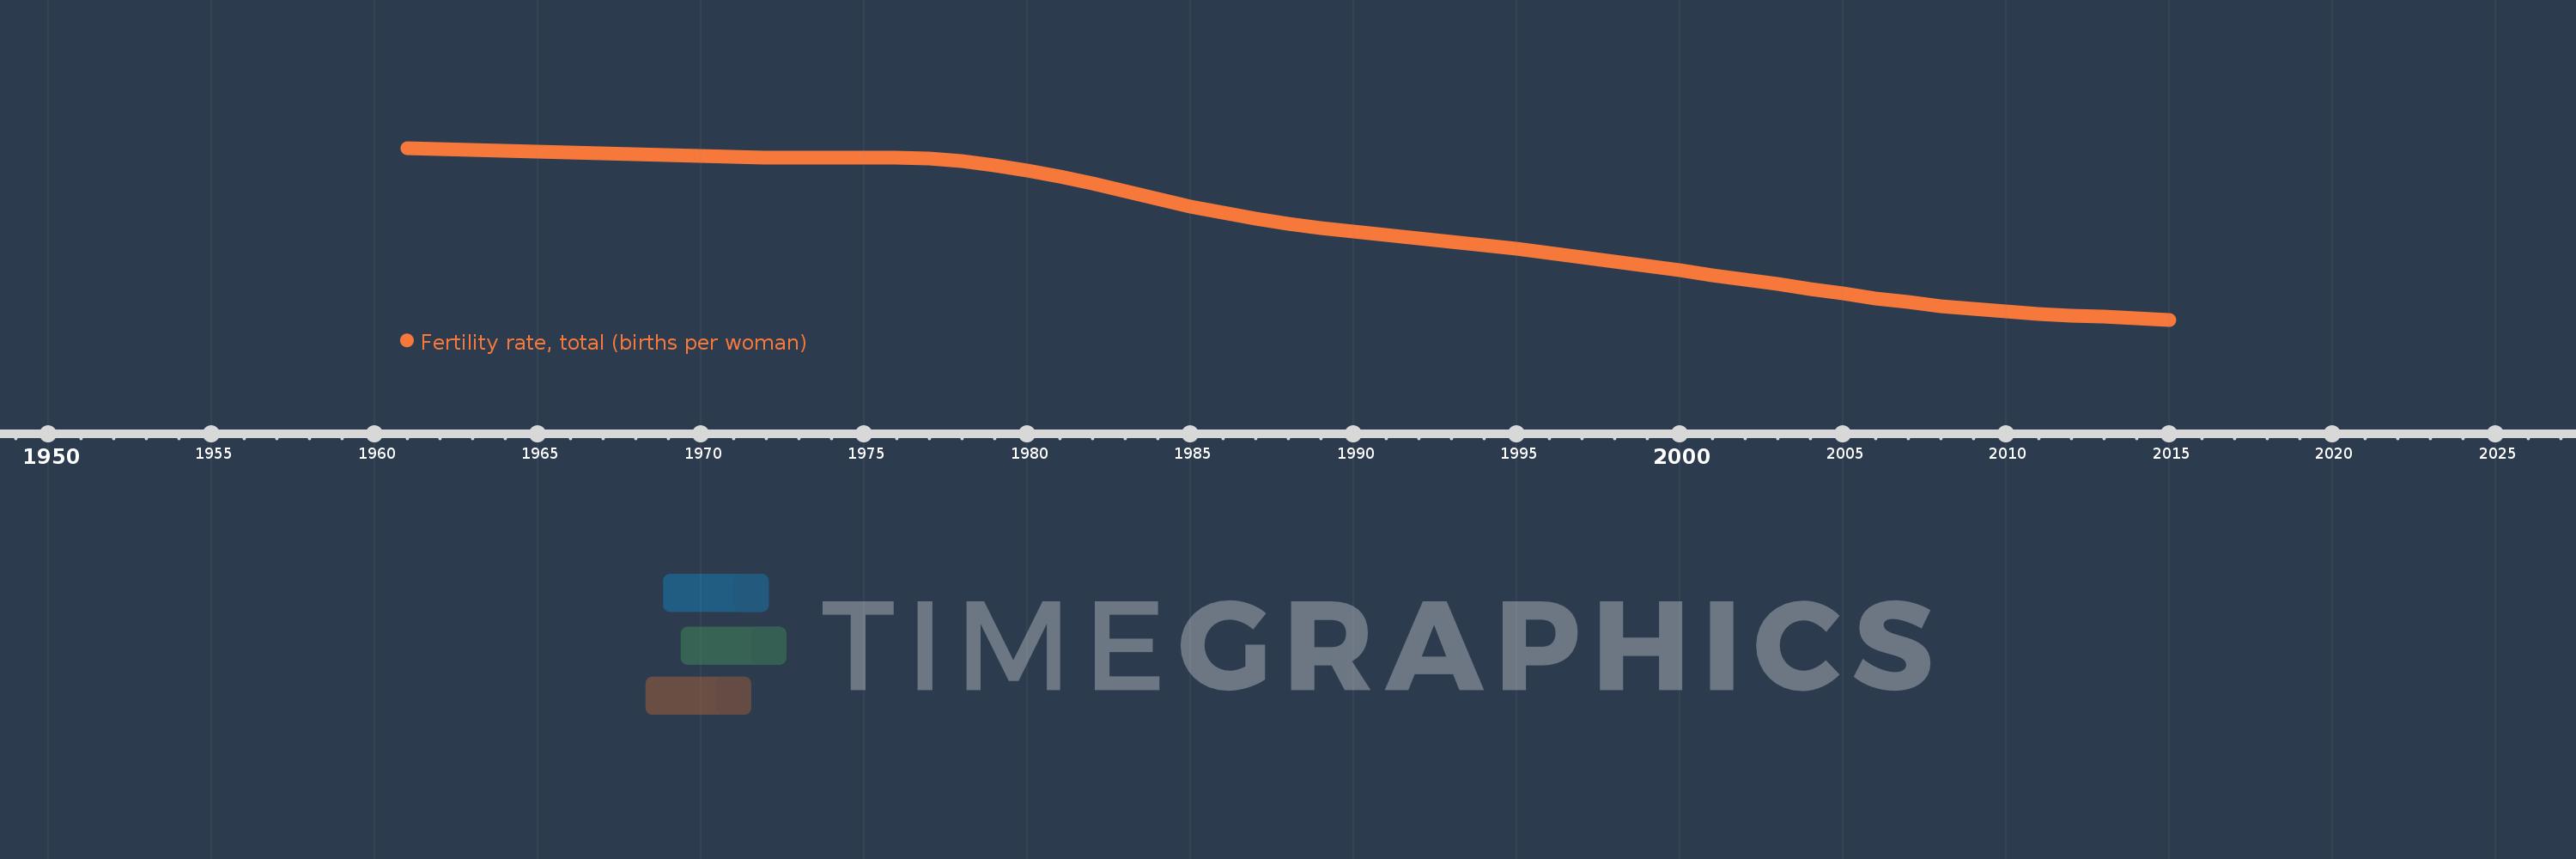
Fertility rate, total (births per woman)
2015,2014,2013,2012,2011,2010,2009,2008,2007,2006,2005,2004,2003,2002,2001,2000,1999,1998,1997,1996,1995,1994,1993,1992,1991,1990,1989,1988,1987,1986,1985,1984,1983,1982,1981,1980,1979,1978,1977,1976,1975,1974,1973,1972,1971,1970,1969,1968,1967,1966,1965,1964,1963,1962,1961
This statistics in other country:
AfghanistanAlbaniaAlgeriaAndorraAngolaAntigua and BarbudaArab WorldArgentinaArmeniaArubaAustraliaAustriaAzerbaijanBahamas, TheBahrainBangladeshBarbadosBelarusBelgiumBelizeBeninBermudaBhutanBoliviaBosnia and HerzegovinaBotswanaBrazilBrunei DarussalamBulgariaBurkina FasoBurundiCabo VerdeCambodiaCameroonCanadaCaribbean small statesCentral African RepublicCentral Europe and the BalticsChadChannel IslandsChileChinaColombiaComorosCongo, Dem. Rep.Congo, Rep.Costa RicaCote d'IvoireCroatiaCubaCuracaoCyprusCzech RepublicDenmarkDjiboutiDominicaDominican RepublicEarly-demographic dividendEast Asia & PacificEast Asia & Pacific (excluding high income)East Asia & Pacific (IDA & IBRD countries)EcuadorEgypt, Arab Rep.El SalvadorEquatorial GuineaEritreaEstoniaEthiopiaEuro areaEurope & Central AsiaEurope & Central Asia (excluding high income)Europe & Central Asia (IDA & IBRD countries)European UnionFaroe IslandsFijiFinlandFragile and conflict affected situationsFranceFrench PolynesiaGabonGambia, TheGeorgiaGermanyGhanaGreeceGreenlandGrenadaGuamGuatemalaGuineaGuinea-BissauGuyanaHaitiHeavily indebted poor countries (HIPC)High incomeHondurasHong Kong SAR, ChinaHungaryIBRD onlyIcelandIDA & IBRD totalIDA blendIDA onlyIDA totalIndiaIndonesiaIran, Islamic Rep.IraqIrelandIsle of ManIsraelItalyJamaicaJapanJordanKazakhstanKenyaKiribatiKorea, Dem. People’s Rep.Korea, Rep.KosovoKuwaitKyrgyz RepublicLao PDRLate-demographic dividendLatin America & Caribbean Latin America & Caribbean (excluding high income)Latin America & the Caribbean (IDA & IBRD countries)LatviaLeast developed countries: UN classificationLebanonLesothoLiberiaLibyaLiechtensteinLithuaniaLow & middle incomeLow incomeLower middle incomeLuxembourgMacao SAR, ChinaMacedonia, FYRMadagascarMalawiMalaysiaMaldivesMaliMaltaMarshall IslandsMauritaniaMauritiusMexicoMicronesia, Fed. Sts.Middle East & North AfricaMiddle East & North Africa (excluding high income)Middle East & North Africa (IDA & IBRD countries)Middle incomeMoldovaMongoliaMontenegroMoroccoMozambiqueMyanmarNamibiaNepalNetherlandsNew CaledoniaNew ZealandNicaraguaNigerNigeriaNorth AmericaNorwayOECD membersOmanOther small statesPacific island small statesPakistanPalauPanamaPapua New GuineaParaguayPeruPhilippinesPolandPortugalPost-demographic dividendPre-demographic dividendPuerto RicoQatarRomaniaRussian FederationRwandaSamoaSan MarinoSao Tome and PrincipeSaudi ArabiaSenegalSerbiaSeychellesSierra LeoneSingaporeSint Maarten (Dutch part)Slovak RepublicSloveniaSmall statesSolomon IslandsSomaliaSouth AfricaSouth AsiaSouth Asia (IDA & IBRD)South SudanSpainSri LankaSt. Kitts and NevisSt. LuciaSt. Martin (French part)St. Vincent and the GrenadinesSub-Saharan Africa Sub-Saharan Africa (excluding high income)Sub-Saharan Africa (IDA & IBRD countries)SudanSurinameSwazilandSwedenSwitzerlandSyrian Arab RepublicTajikistanTanzaniaThailandTimor-LesteTogoTongaTrinidad and TobagoTunisiaTurkeyTurkmenistanUgandaUkraineUnited Arab EmiratesUnited KingdomUnited StatesUpper middle incomeUruguayUzbekistanVanuatuVenezuela, RBVietnamVirgin Islands (U.S.)West Bank and GazaWorldYemen, Rep.ZambiaZimbabwe Timeline:
This timeline shows a graph from 1961 to 2015 of Belize. No data until 1960. Number of actual observations by date: 55.
Source name:
World Development Indicators
Source organization:
(1) United Nations Population Division. World Population Prospects, (2) Census reports and other statistical publications from national statistical offices, (3) Eurostat: Demographic Statistics, (4) United Nations Statistical Division. Population and Vital Statistics Reprot (various years), (5) U.S. Census Bureau: International Database, and (6) Secretariat of the Pacific Community: Statistics and Demography Programme.
Categories, topics:
Health, Gender
Last updated:
apr 23, 2017
Indicators value changes by year
At the date of observation
Value
Absolute change
Change from previous value
jan 1, 1962
6.48
-0.02
-0.31%
jan 1, 1963
6.46
-0.02
-0.31%
jan 1, 1964
6.44
-0.02
-0.31%
jan 1, 1965
6.42
-0.02
-0.31%
jan 1, 1966
6.4
-0.02
-0.31%
jan 1, 1967
6.379
-0.021
-0.33%
jan 1, 1968
6.358
-0.021
-0.33%
jan 1, 1969
6.337
-0.021
-0.33%
jan 1, 1970
6.316
-0.021
-0.33%
jan 1, 1971
6.299
-0.017
-0.27%
jan 1, 1972
6.288
-0.011
-0.17%
jan 1, 1973
6.284
-0.004
-0.06%
jan 1, 1974
6.285
+0.001
0.02%
jan 1, 1975
6.286
+0.001
0.02%
jan 1, 1976
6.278
-0.008
-0.13%
jan 1, 1977
6.25
-0.028
-0.45%
jan 1, 1978
6.195
-0.055
-0.88%
jan 1, 1979
6.109
-0.086
-1.39%
jan 1, 1980
5.992
-0.117
-1.92%
jan 1, 1981
5.849
-0.143
-2.39%
jan 1, 1982
5.684
-0.165
-2.82%
jan 1, 1983
5.51
-0.174
-3.06%
jan 1, 1984
5.336
-0.174
-3.16%
jan 1, 1985
5.17
-0.166
-3.11%
jan 1, 1986
5.019
-0.151
-2.92%
jan 1, 1987
4.886
-0.133
-2.65%
jan 1, 1988
4.771
-0.115
-2.35%
jan 1, 1989
4.671
-0.1
-2.1%
jan 1, 1990
4.584
-0.087
-1.86%
jan 1, 1991
4.508
-0.076
-1.66%
jan 1, 1992
4.436
-0.072
-1.6%
jan 1, 1993
4.363
-0.073
-1.65%
jan 1, 1994
4.286
-0.077
-1.76%
jan 1, 1995
4.201
-0.085
-1.98%
jan 1, 1996
4.109
-0.092
-2.19%
jan 1, 1997
4.01
-0.099
-2.41%
jan 1, 1998
3.908
-0.102
-2.54%
jan 1, 1999
3.805
-0.103
-2.64%
jan 1, 2000
3.703
-0.102
-2.68%
jan 1, 2001
3.6
-0.103
-2.78%
jan 1, 2002
3.496
-0.104
-2.89%
jan 1, 2003
3.39
-0.106
-3.03%
jan 1, 2004
3.282
-0.108
-3.19%
jan 1, 2005
3.175
-0.107
-3.26%
jan 1, 2006
3.072
-0.103
-3.24%
jan 1, 2007
2.977
-0.095
-3.09%
jan 1, 2008
2.893
-0.084
-2.82%
jan 1, 2009
2.821
-0.072
-2.49%
jan 1, 2010
2.762
-0.059
-2.09%
jan 1, 2011
2.714
-0.048
-1.74%
jan 1, 2012
2.676
-0.038
-1.4%
jan 1, 2013
2.643
-0.033
-1.23%
jan 1, 2014
2.611
-0.032
-1.21%
jan 1, 2015
2.579
-0.032
-1.23%
Ranking of countries by current statistics by years


Comments: