29
/
en
AIzaSyAYiBZKx7MnpbEhh9jyipgxe19OcubqV5w
April 1, 2024
144321
Guatemala
GTM
true
2
1
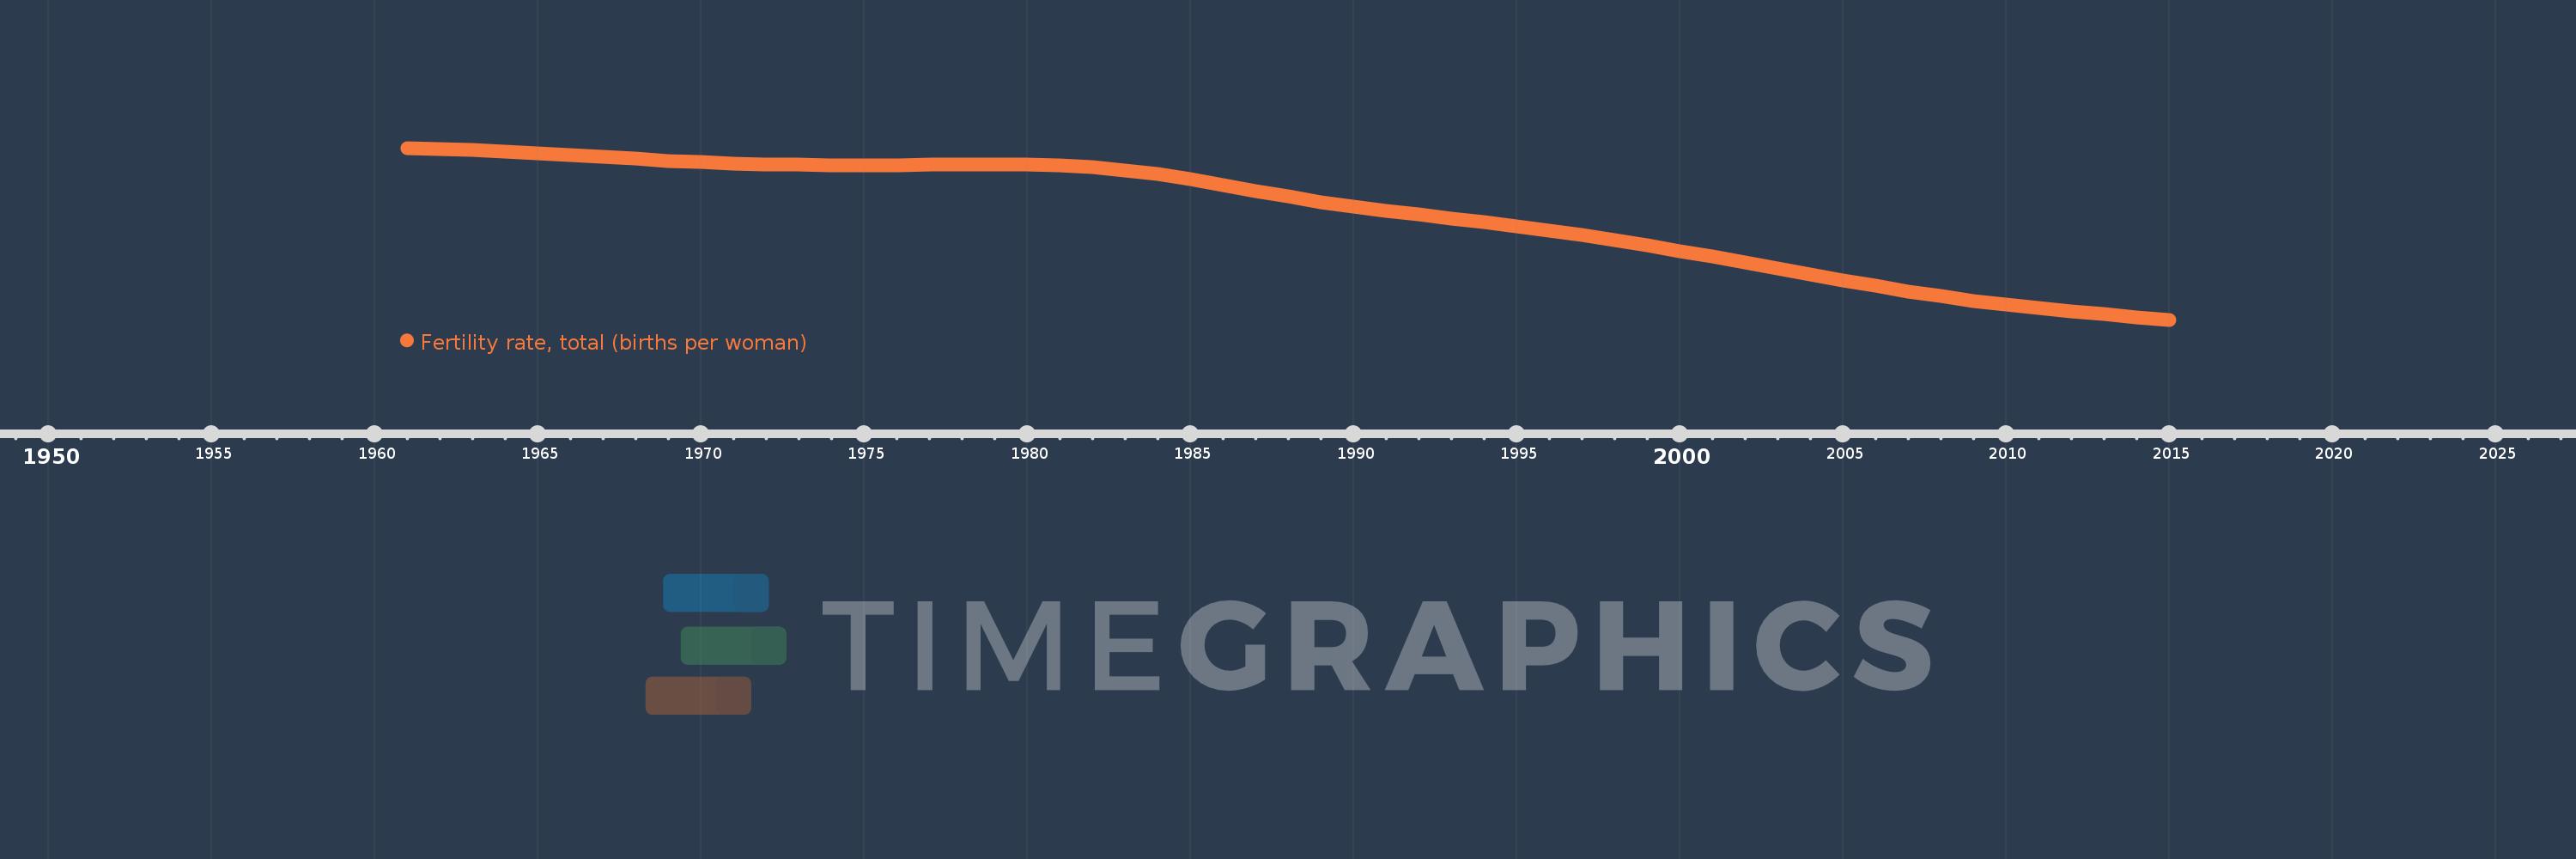
Fertility rate, total (births per woman)
2015,2014,2013,2012,2011,2010,2009,2008,2007,2006,2005,2004,2003,2002,2001,2000,1999,1998,1997,1996,1995,1994,1993,1992,1991,1990,1989,1988,1987,1986,1985,1984,1983,1982,1981,1980,1979,1978,1977,1976,1975,1974,1973,1972,1971,1970,1969,1968,1967,1966,1965,1964,1963,1962,1961
This statistics in other country:
AfghanistanAlbaniaAlgeriaAndorraAngolaAntigua and BarbudaArab WorldArgentinaArmeniaArubaAustraliaAustriaAzerbaijanBahamas, TheBahrainBangladeshBarbadosBelarusBelgiumBelizeBeninBermudaBhutanBoliviaBosnia and HerzegovinaBotswanaBrazilBrunei DarussalamBulgariaBurkina FasoBurundiCabo VerdeCambodiaCameroonCanadaCaribbean small statesCentral African RepublicCentral Europe and the BalticsChadChannel IslandsChileChinaColombiaComorosCongo, Dem. Rep.Congo, Rep.Costa RicaCote d'IvoireCroatiaCubaCuracaoCyprusCzech RepublicDenmarkDjiboutiDominicaDominican RepublicEarly-demographic dividendEast Asia & PacificEast Asia & Pacific (excluding high income)East Asia & Pacific (IDA & IBRD countries)EcuadorEgypt, Arab Rep.El SalvadorEquatorial GuineaEritreaEstoniaEthiopiaEuro areaEurope & Central AsiaEurope & Central Asia (excluding high income)Europe & Central Asia (IDA & IBRD countries)European UnionFaroe IslandsFijiFinlandFragile and conflict affected situationsFranceFrench PolynesiaGabonGambia, TheGeorgiaGermanyGhanaGreeceGreenlandGrenadaGuamGuatemalaGuineaGuinea-BissauGuyanaHaitiHeavily indebted poor countries (HIPC)High incomeHondurasHong Kong SAR, ChinaHungaryIBRD onlyIcelandIDA & IBRD totalIDA blendIDA onlyIDA totalIndiaIndonesiaIran, Islamic Rep.IraqIrelandIsle of ManIsraelItalyJamaicaJapanJordanKazakhstanKenyaKiribatiKorea, Dem. People’s Rep.Korea, Rep.KosovoKuwaitKyrgyz RepublicLao PDRLate-demographic dividendLatin America & Caribbean Latin America & Caribbean (excluding high income)Latin America & the Caribbean (IDA & IBRD countries)LatviaLeast developed countries: UN classificationLebanonLesothoLiberiaLibyaLiechtensteinLithuaniaLow & middle incomeLow incomeLower middle incomeLuxembourgMacao SAR, ChinaMacedonia, FYRMadagascarMalawiMalaysiaMaldivesMaliMaltaMarshall IslandsMauritaniaMauritiusMexicoMicronesia, Fed. Sts.Middle East & North AfricaMiddle East & North Africa (excluding high income)Middle East & North Africa (IDA & IBRD countries)Middle incomeMoldovaMongoliaMontenegroMoroccoMozambiqueMyanmarNamibiaNepalNetherlandsNew CaledoniaNew ZealandNicaraguaNigerNigeriaNorth AmericaNorwayOECD membersOmanOther small statesPacific island small statesPakistanPalauPanamaPapua New GuineaParaguayPeruPhilippinesPolandPortugalPost-demographic dividendPre-demographic dividendPuerto RicoQatarRomaniaRussian FederationRwandaSamoaSan MarinoSao Tome and PrincipeSaudi ArabiaSenegalSerbiaSeychellesSierra LeoneSingaporeSint Maarten (Dutch part)Slovak RepublicSloveniaSmall statesSolomon IslandsSomaliaSouth AfricaSouth AsiaSouth Asia (IDA & IBRD)South SudanSpainSri LankaSt. Kitts and NevisSt. LuciaSt. Martin (French part)St. Vincent and the GrenadinesSub-Saharan Africa Sub-Saharan Africa (excluding high income)Sub-Saharan Africa (IDA & IBRD countries)SudanSurinameSwazilandSwedenSwitzerlandSyrian Arab RepublicTajikistanTanzaniaThailandTimor-LesteTogoTongaTrinidad and TobagoTunisiaTurkeyTurkmenistanUgandaUkraineUnited Arab EmiratesUnited KingdomUnited StatesUpper middle incomeUruguayUzbekistanVanuatuVenezuela, RBVietnamVirgin Islands (U.S.)West Bank and GazaWorldYemen, Rep.ZambiaZimbabwe Timeline:
This timeline shows a graph from 1961 to 2015 of Guatemala. No data until 1960. Number of actual observations by date: 55.
Source name:
World Development Indicators
Source organization:
(1) United Nations Population Division. World Population Prospects, (2) Census reports and other statistical publications from national statistical offices, (3) Eurostat: Demographic Statistics, (4) United Nations Statistical Division. Population and Vital Statistics Reprot (various years), (5) U.S. Census Bureau: International Database, and (6) Secretariat of the Pacific Community: Statistics and Demography Programme.
Categories, topics:
Health, Gender
Last updated:
apr 23, 2017
Indicators value changes by year
At the date of observation
Value
Absolute change
Change from previous value
jan 1, 1961
6.534
+6.534
0.0%
jan 1, 1962
6.512
-0.022
-0.34%
jan 1, 1963
6.49
-0.022
-0.34%
jan 1, 1964
6.464
-0.026
-0.4%
jan 1, 1965
6.434
-0.03
-0.46%
jan 1, 1966
6.399
-0.035
-0.54%
jan 1, 1967
6.36
-0.039
-0.61%
jan 1, 1968
6.323
-0.037
-0.58%
jan 1, 1969
6.288
-0.035
-0.55%
jan 1, 1970
6.259
-0.029
-0.46%
jan 1, 1971
6.235
-0.024
-0.38%
jan 1, 1972
6.219
-0.016
-0.26%
jan 1, 1973
6.208
-0.011
-0.18%
jan 1, 1974
6.203
-0.005
-0.08%
jan 1, 1975
6.201
-0.002
-0.03%
jan 1, 1976
6.202
+0.001
0.02%
jan 1, 1977
6.206
+0.004
0.06%
jan 1, 1978
6.211
+0.005
0.08%
jan 1, 1979
6.213
+0.002
0.03%
jan 1, 1980
6.21
-0.003
-0.05%
jan 1, 1981
6.195
-0.015
-0.24%
jan 1, 1982
6.161
-0.034
-0.55%
jan 1, 1983
6.105
-0.056
-0.91%
jan 1, 1984
6.027
-0.078
-1.28%
jan 1, 1985
5.93
-0.097
-1.61%
jan 1, 1986
5.82
-0.11
-1.85%
jan 1, 1987
5.704
-0.116
-1.99%
jan 1, 1988
5.591
-0.113
-1.98%
jan 1, 1989
5.488
-0.103
-1.84%
jan 1, 1990
5.396
-0.092
-1.68%
jan 1, 1991
5.315
-0.081
-1.5%
jan 1, 1992
5.244
-0.071
-1.34%
jan 1, 1993
5.174
-0.07
-1.33%
jan 1, 1994
5.102
-0.072
-1.39%
jan 1, 1995
5.024
-0.078
-1.53%
jan 1, 1996
4.939
-0.085
-1.69%
jan 1, 1997
4.847
-0.092
-1.86%
jan 1, 1998
4.75
-0.097
-2.0%
jan 1, 1999
4.648
-0.102
-2.15%
jan 1, 2000
4.543
-0.105
-2.26%
jan 1, 2001
4.434
-0.109
-2.4%
jan 1, 2002
4.322
-0.112
-2.53%
jan 1, 2003
4.207
-0.115
-2.66%
jan 1, 2004
4.091
-0.116
-2.76%
jan 1, 2005
3.976
-0.115
-2.81%
jan 1, 2006
3.865
-0.111
-2.79%
jan 1, 2007
3.76
-0.105
-2.72%
jan 1, 2008
3.664
-0.096
-2.55%
jan 1, 2009
3.578
-0.086
-2.35%
jan 1, 2010
3.501
-0.077
-2.15%
jan 1, 2011
3.434
-0.067
-1.91%
jan 1, 2012
3.373
-0.061
-1.78%
jan 1, 2013
3.317
-0.056
-1.66%
jan 1, 2014
3.263
-0.054
-1.63%
jan 1, 2015
3.211
-0.052
-1.59%
Ranking of countries by current statistics by years


Comments: