29
/
en
AIzaSyAYiBZKx7MnpbEhh9jyipgxe19OcubqV5w
April 1, 2024
122077
Dominican Republic
DOM
true
2
1
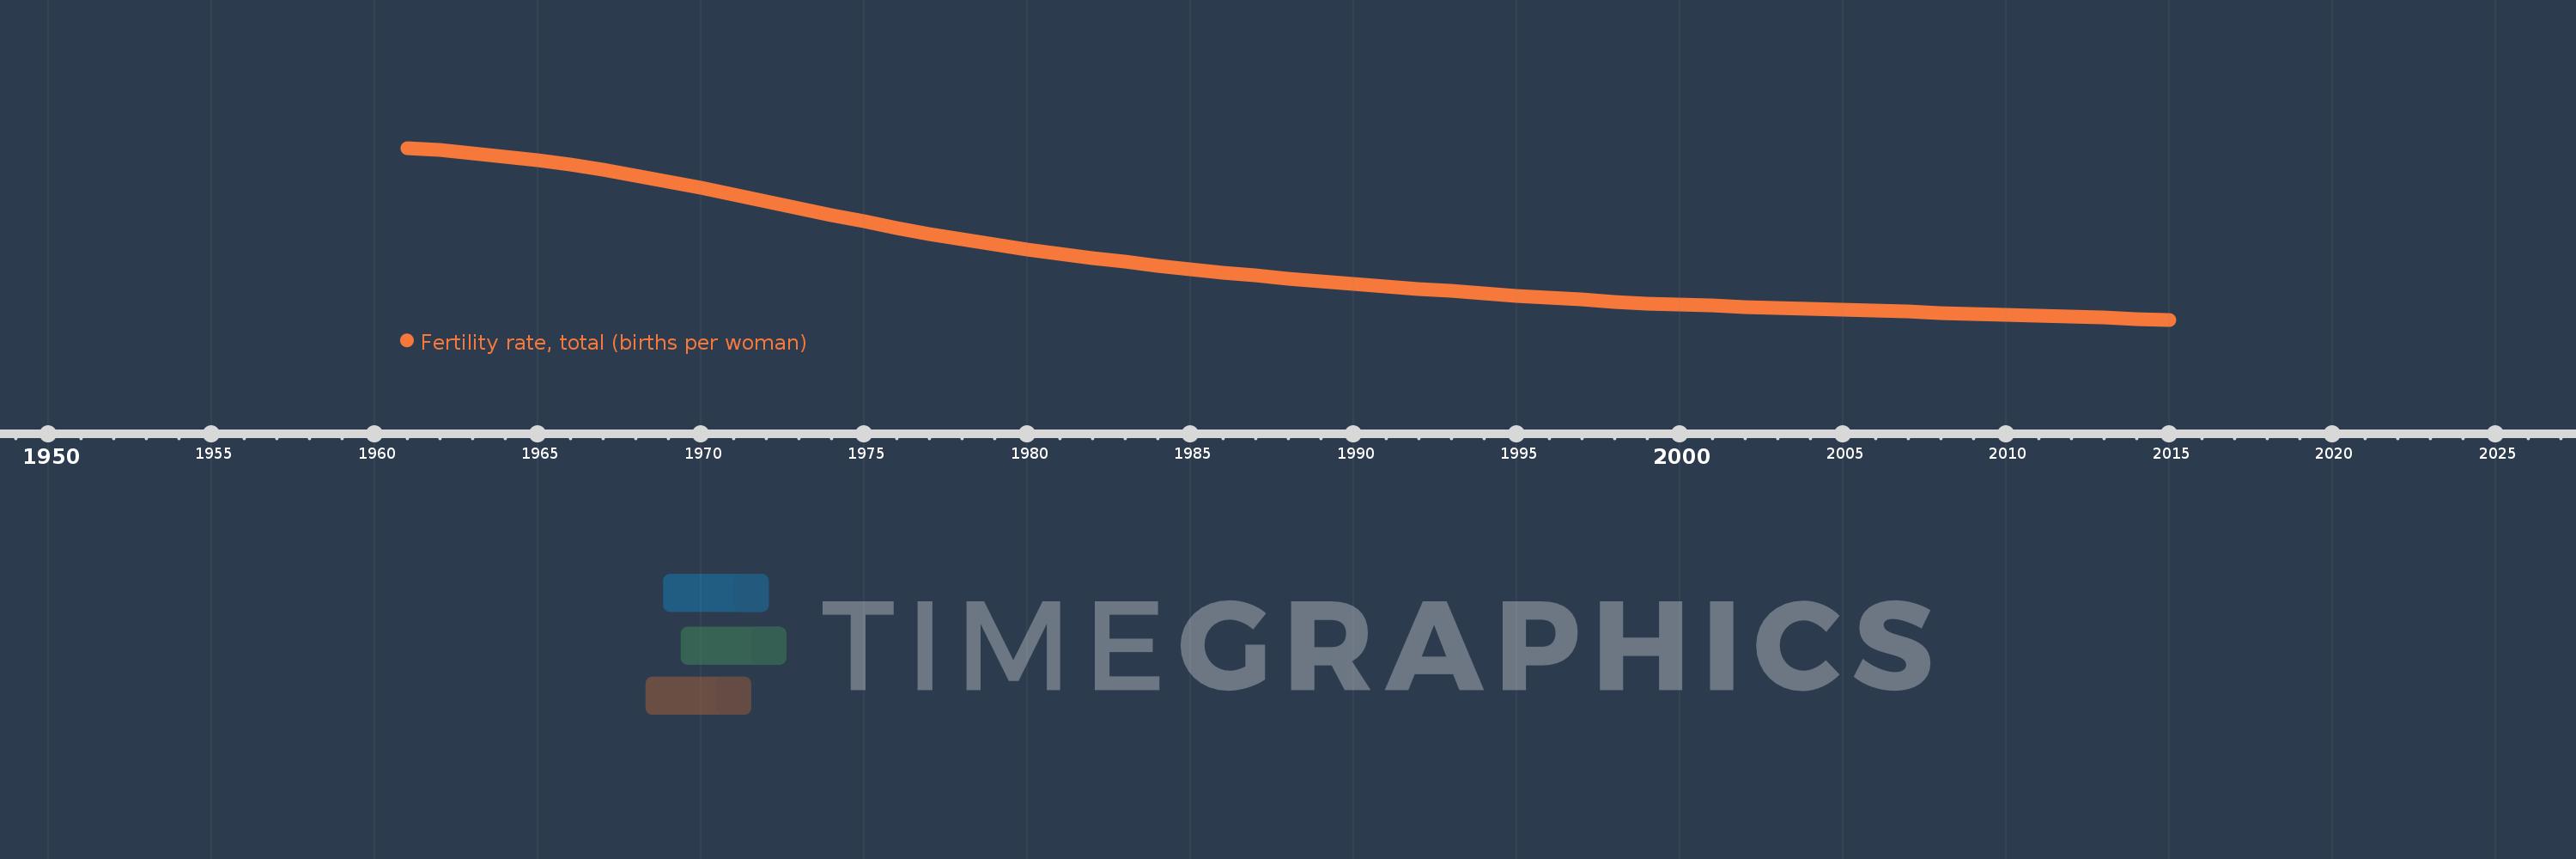
Fertility rate, total (births per woman)
2015,2014,2013,2012,2011,2010,2009,2008,2007,2006,2005,2004,2003,2002,2001,2000,1999,1998,1997,1996,1995,1994,1993,1992,1991,1990,1989,1988,1987,1986,1985,1984,1983,1982,1981,1980,1979,1978,1977,1976,1975,1974,1973,1972,1971,1970,1969,1968,1967,1966,1965,1964,1963,1962,1961
This statistics in other country:
AfghanistanAlbaniaAlgeriaAndorraAngolaAntigua and BarbudaArab WorldArgentinaArmeniaArubaAustraliaAustriaAzerbaijanBahamas, TheBahrainBangladeshBarbadosBelarusBelgiumBelizeBeninBermudaBhutanBoliviaBosnia and HerzegovinaBotswanaBrazilBrunei DarussalamBulgariaBurkina FasoBurundiCabo VerdeCambodiaCameroonCanadaCaribbean small statesCentral African RepublicCentral Europe and the BalticsChadChannel IslandsChileChinaColombiaComorosCongo, Dem. Rep.Congo, Rep.Costa RicaCote d'IvoireCroatiaCubaCuracaoCyprusCzech RepublicDenmarkDjiboutiDominicaDominican RepublicEarly-demographic dividendEast Asia & PacificEast Asia & Pacific (excluding high income)East Asia & Pacific (IDA & IBRD countries)EcuadorEgypt, Arab Rep.El SalvadorEquatorial GuineaEritreaEstoniaEthiopiaEuro areaEurope & Central AsiaEurope & Central Asia (excluding high income)Europe & Central Asia (IDA & IBRD countries)European UnionFaroe IslandsFijiFinlandFragile and conflict affected situationsFranceFrench PolynesiaGabonGambia, TheGeorgiaGermanyGhanaGreeceGreenlandGrenadaGuamGuatemalaGuineaGuinea-BissauGuyanaHaitiHeavily indebted poor countries (HIPC)High incomeHondurasHong Kong SAR, ChinaHungaryIBRD onlyIcelandIDA & IBRD totalIDA blendIDA onlyIDA totalIndiaIndonesiaIran, Islamic Rep.IraqIrelandIsle of ManIsraelItalyJamaicaJapanJordanKazakhstanKenyaKiribatiKorea, Dem. People’s Rep.Korea, Rep.KosovoKuwaitKyrgyz RepublicLao PDRLate-demographic dividendLatin America & Caribbean Latin America & Caribbean (excluding high income)Latin America & the Caribbean (IDA & IBRD countries)LatviaLeast developed countries: UN classificationLebanonLesothoLiberiaLibyaLiechtensteinLithuaniaLow & middle incomeLow incomeLower middle incomeLuxembourgMacao SAR, ChinaMacedonia, FYRMadagascarMalawiMalaysiaMaldivesMaliMaltaMarshall IslandsMauritaniaMauritiusMexicoMicronesia, Fed. Sts.Middle East & North AfricaMiddle East & North Africa (excluding high income)Middle East & North Africa (IDA & IBRD countries)Middle incomeMoldovaMongoliaMontenegroMoroccoMozambiqueMyanmarNamibiaNepalNetherlandsNew CaledoniaNew ZealandNicaraguaNigerNigeriaNorth AmericaNorwayOECD membersOmanOther small statesPacific island small statesPakistanPalauPanamaPapua New GuineaParaguayPeruPhilippinesPolandPortugalPost-demographic dividendPre-demographic dividendPuerto RicoQatarRomaniaRussian FederationRwandaSamoaSan MarinoSao Tome and PrincipeSaudi ArabiaSenegalSerbiaSeychellesSierra LeoneSingaporeSint Maarten (Dutch part)Slovak RepublicSloveniaSmall statesSolomon IslandsSomaliaSouth AfricaSouth AsiaSouth Asia (IDA & IBRD)South SudanSpainSri LankaSt. Kitts and NevisSt. LuciaSt. Martin (French part)St. Vincent and the GrenadinesSub-Saharan Africa Sub-Saharan Africa (excluding high income)Sub-Saharan Africa (IDA & IBRD countries)SudanSurinameSwazilandSwedenSwitzerlandSyrian Arab RepublicTajikistanTanzaniaThailandTimor-LesteTogoTongaTrinidad and TobagoTunisiaTurkeyTurkmenistanUgandaUkraineUnited Arab EmiratesUnited KingdomUnited StatesUpper middle incomeUruguayUzbekistanVanuatuVenezuela, RBVietnamVirgin Islands (U.S.)West Bank and GazaWorldYemen, Rep.ZambiaZimbabwe Timeline:
This timeline shows a graph from 1961 to 2015 of Dominican Republic. No data until 1960. Number of actual observations by date: 55.
Source name:
World Development Indicators
Source organization:
(1) United Nations Population Division. World Population Prospects, (2) Census reports and other statistical publications from national statistical offices, (3) Eurostat: Demographic Statistics, (4) United Nations Statistical Division. Population and Vital Statistics Reprot (various years), (5) U.S. Census Bureau: International Database, and (6) Secretariat of the Pacific Community: Statistics and Demography Programme.
Categories, topics:
Health, Gender
Last updated:
apr 23, 2017
Indicators value changes by year
At the date of observation
Value
Absolute change
Change from previous value
jan 1, 1961
7.555
+7.555
0.0%
jan 1, 1962
7.487
-0.068
-0.9%
jan 1, 1963
7.404
-0.083
-1.11%
jan 1, 1964
7.303
-0.101
-1.36%
jan 1, 1965
7.186
-0.117
-1.6%
jan 1, 1966
7.053
-0.133
-1.85%
jan 1, 1967
6.903
-0.15
-2.13%
jan 1, 1968
6.738
-0.165
-2.39%
jan 1, 1969
6.561
-0.177
-2.63%
jan 1, 1970
6.375
-0.186
-2.83%
jan 1, 1971
6.182
-0.193
-3.03%
jan 1, 1972
5.983
-0.199
-3.22%
jan 1, 1973
5.781
-0.202
-3.38%
jan 1, 1974
5.58
-0.201
-3.48%
jan 1, 1975
5.382
-0.198
-3.55%
jan 1, 1976
5.193
-0.189
-3.51%
jan 1, 1977
5.014
-0.179
-3.45%
jan 1, 1978
4.847
-0.167
-3.33%
jan 1, 1979
4.693
-0.154
-3.18%
jan 1, 1980
4.552
-0.141
-3.0%
jan 1, 1981
4.422
-0.13
-2.86%
jan 1, 1982
4.303
-0.119
-2.69%
jan 1, 1983
4.19
-0.113
-2.63%
jan 1, 1984
4.082
-0.108
-2.58%
jan 1, 1985
3.978
-0.104
-2.55%
jan 1, 1986
3.878
-0.1
-2.51%
jan 1, 1987
3.783
-0.095
-2.45%
jan 1, 1988
3.694
-0.089
-2.35%
jan 1, 1989
3.612
-0.082
-2.22%
jan 1, 1990
3.537
-0.075
-2.08%
jan 1, 1991
3.465
-0.072
-2.04%
jan 1, 1992
3.397
-0.068
-1.96%
jan 1, 1993
3.329
-0.068
-2.0%
jan 1, 1994
3.262
-0.067
-2.01%
jan 1, 1995
3.195
-0.067
-2.05%
jan 1, 1996
3.13
-0.065
-2.03%
jan 1, 1997
3.069
-0.061
-1.95%
jan 1, 1998
3.014
-0.055
-1.79%
jan 1, 1999
2.966
-0.048
-1.59%
jan 1, 2000
2.926
-0.04
-1.35%
jan 1, 2001
2.892
-0.034
-1.16%
jan 1, 2002
2.862
-0.03
-1.04%
jan 1, 2003
2.835
-0.027
-0.94%
jan 1, 2004
2.807
-0.028
-0.99%
jan 1, 2005
2.779
-0.028
-1.0%
jan 1, 2006
2.749
-0.03
-1.08%
jan 1, 2007
2.718
-0.031
-1.13%
jan 1, 2008
2.687
-0.031
-1.14%
jan 1, 2009
2.656
-0.031
-1.15%
jan 1, 2010
2.627
-0.029
-1.09%
jan 1, 2011
2.597
-0.03
-1.14%
jan 1, 2012
2.568
-0.029
-1.12%
jan 1, 2013
2.539
-0.029
-1.13%
jan 1, 2014
2.51
-0.029
-1.14%
jan 1, 2015
2.48
-0.03
-1.2%
Ranking of countries by current statistics by years


Comments: