29
/
en
AIzaSyAYiBZKx7MnpbEhh9jyipgxe19OcubqV5w
April 1, 2024
171661
Kuwait
KWT
true
2
1
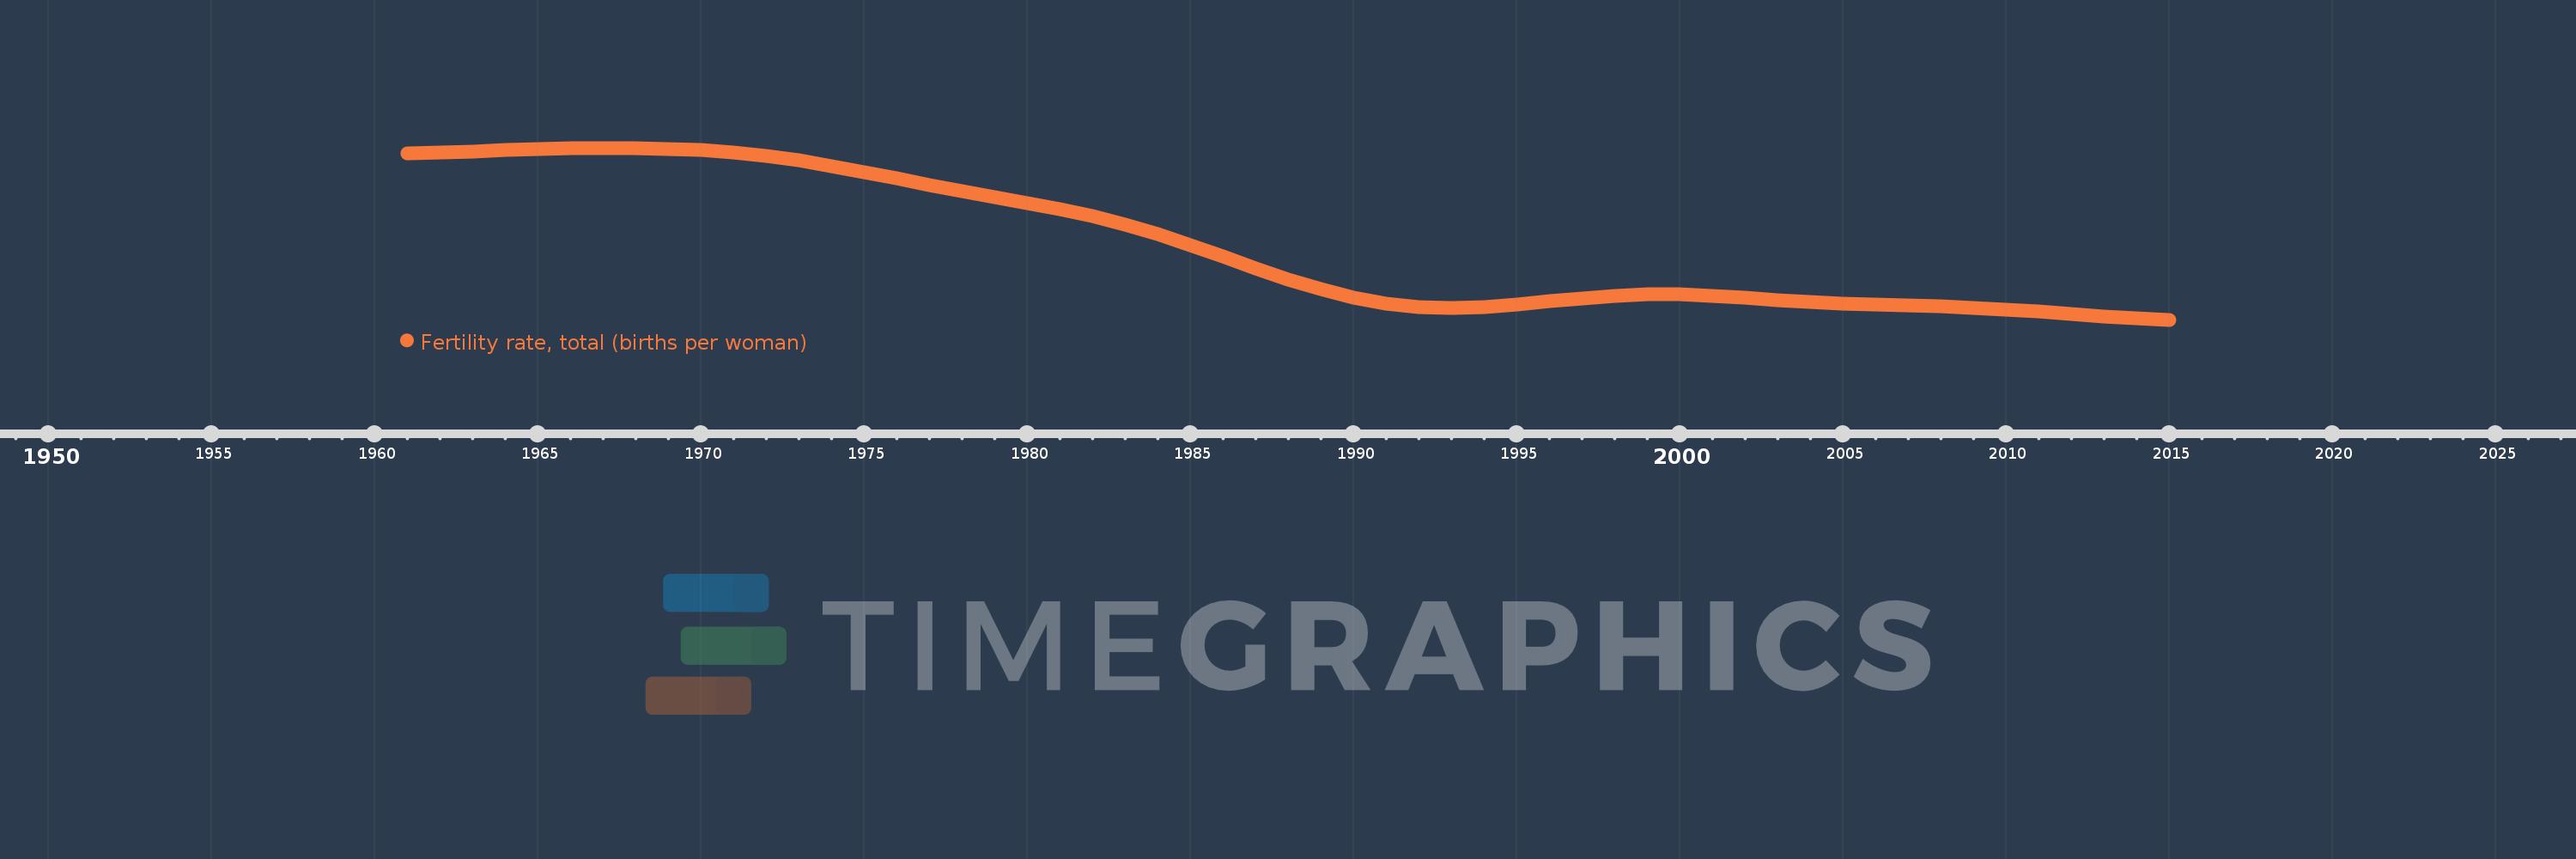
Fertility rate, total (births per woman)
2015,2014,2013,2012,2011,2010,2009,2008,2007,2006,2005,2004,2003,2002,2001,2000,1999,1998,1997,1996,1995,1994,1993,1992,1991,1990,1989,1988,1987,1986,1985,1984,1983,1982,1981,1980,1979,1978,1977,1976,1975,1974,1973,1972,1971,1970,1969,1968,1967,1966,1965,1964,1963,1962,1961
This statistics in other country:
AfghanistanAlbaniaAlgeriaAndorraAngolaAntigua and BarbudaArab WorldArgentinaArmeniaArubaAustraliaAustriaAzerbaijanBahamas, TheBahrainBangladeshBarbadosBelarusBelgiumBelizeBeninBermudaBhutanBoliviaBosnia and HerzegovinaBotswanaBrazilBrunei DarussalamBulgariaBurkina FasoBurundiCabo VerdeCambodiaCameroonCanadaCaribbean small statesCentral African RepublicCentral Europe and the BalticsChadChannel IslandsChileChinaColombiaComorosCongo, Dem. Rep.Congo, Rep.Costa RicaCote d'IvoireCroatiaCubaCuracaoCyprusCzech RepublicDenmarkDjiboutiDominicaDominican RepublicEarly-demographic dividendEast Asia & PacificEast Asia & Pacific (excluding high income)East Asia & Pacific (IDA & IBRD countries)EcuadorEgypt, Arab Rep.El SalvadorEquatorial GuineaEritreaEstoniaEthiopiaEuro areaEurope & Central AsiaEurope & Central Asia (excluding high income)Europe & Central Asia (IDA & IBRD countries)European UnionFaroe IslandsFijiFinlandFragile and conflict affected situationsFranceFrench PolynesiaGabonGambia, TheGeorgiaGermanyGhanaGreeceGreenlandGrenadaGuamGuatemalaGuineaGuinea-BissauGuyanaHaitiHeavily indebted poor countries (HIPC)High incomeHondurasHong Kong SAR, ChinaHungaryIBRD onlyIcelandIDA & IBRD totalIDA blendIDA onlyIDA totalIndiaIndonesiaIran, Islamic Rep.IraqIrelandIsle of ManIsraelItalyJamaicaJapanJordanKazakhstanKenyaKiribatiKorea, Dem. People’s Rep.Korea, Rep.KosovoKuwaitKyrgyz RepublicLao PDRLate-demographic dividendLatin America & Caribbean Latin America & Caribbean (excluding high income)Latin America & the Caribbean (IDA & IBRD countries)LatviaLeast developed countries: UN classificationLebanonLesothoLiberiaLibyaLiechtensteinLithuaniaLow & middle incomeLow incomeLower middle incomeLuxembourgMacao SAR, ChinaMacedonia, FYRMadagascarMalawiMalaysiaMaldivesMaliMaltaMarshall IslandsMauritaniaMauritiusMexicoMicronesia, Fed. Sts.Middle East & North AfricaMiddle East & North Africa (excluding high income)Middle East & North Africa (IDA & IBRD countries)Middle incomeMoldovaMongoliaMontenegroMoroccoMozambiqueMyanmarNamibiaNepalNetherlandsNew CaledoniaNew ZealandNicaraguaNigerNigeriaNorth AmericaNorwayOECD membersOmanOther small statesPacific island small statesPakistanPalauPanamaPapua New GuineaParaguayPeruPhilippinesPolandPortugalPost-demographic dividendPre-demographic dividendPuerto RicoQatarRomaniaRussian FederationRwandaSamoaSan MarinoSao Tome and PrincipeSaudi ArabiaSenegalSerbiaSeychellesSierra LeoneSingaporeSint Maarten (Dutch part)Slovak RepublicSloveniaSmall statesSolomon IslandsSomaliaSouth AfricaSouth AsiaSouth Asia (IDA & IBRD)South SudanSpainSri LankaSt. Kitts and NevisSt. LuciaSt. Martin (French part)St. Vincent and the GrenadinesSub-Saharan Africa Sub-Saharan Africa (excluding high income)Sub-Saharan Africa (IDA & IBRD countries)SudanSurinameSwazilandSwedenSwitzerlandSyrian Arab RepublicTajikistanTanzaniaThailandTimor-LesteTogoTongaTrinidad and TobagoTunisiaTurkeyTurkmenistanUgandaUkraineUnited Arab EmiratesUnited KingdomUnited StatesUpper middle incomeUruguayUzbekistanVanuatuVenezuela, RBVietnamVirgin Islands (U.S.)West Bank and GazaWorldYemen, Rep.ZambiaZimbabwe Timeline:
This timeline shows a graph from 1961 to 2015 of Kuwait. No data until 1960. Number of actual observations by date: 55.
Source name:
World Development Indicators
Source organization:
(1) United Nations Population Division. World Population Prospects, (2) Census reports and other statistical publications from national statistical offices, (3) Eurostat: Demographic Statistics, (4) United Nations Statistical Division. Population and Vital Statistics Reprot (various years), (5) U.S. Census Bureau: International Database, and (6) Secretariat of the Pacific Community: Statistics and Demography Programme.
Categories, topics:
Health, Gender
Last updated:
apr 23, 2017
Indicators value changes by year
At the date of observation
Value
Absolute change
Change from previous value
jan 1, 1961
7.243
+7.243
0.0%
jan 1, 1962
7.27
+0.027
0.37%
jan 1, 1963
7.302
+0.032
0.44%
jan 1, 1964
7.336
+0.034
0.47%
jan 1, 1965
7.368
+0.032
0.44%
jan 1, 1966
7.394
+0.026
0.35%
jan 1, 1967
7.408
+0.014
0.19%
jan 1, 1968
7.406
-0.002
-0.03%
jan 1, 1969
7.384
-0.022
-0.3%
jan 1, 1970
7.338
-0.046
-0.62%
jan 1, 1971
7.263
-0.075
-1.02%
jan 1, 1972
7.155
-0.108
-1.49%
jan 1, 1973
7.016
-0.139
-1.94%
jan 1, 1974
6.851
-0.165
-2.35%
jan 1, 1975
6.664
-0.187
-2.73%
jan 1, 1976
6.464
-0.2
-3.0%
jan 1, 1977
6.264
-0.2
-3.09%
jan 1, 1978
6.068
-0.196
-3.13%
jan 1, 1979
5.881
-0.187
-3.08%
jan 1, 1980
5.699
-0.182
-3.09%
jan 1, 1981
5.51
-0.189
-3.32%
jan 1, 1982
5.295
-0.215
-3.9%
jan 1, 1983
5.042
-0.253
-4.78%
jan 1, 1984
4.746
-0.296
-5.87%
jan 1, 1985
4.414
-0.332
-7.0%
jan 1, 1986
4.059
-0.355
-8.04%
jan 1, 1987
3.696
-0.363
-8.94%
jan 1, 1988
3.349
-0.347
-9.39%
jan 1, 1989
3.039
-0.31
-9.26%
jan 1, 1990
2.782
-0.257
-8.46%
jan 1, 1991
2.593
-0.189
-6.79%
jan 1, 1992
2.487
-0.106
-4.09%
jan 1, 1993
2.456
-0.031
-1.25%
jan 1, 1994
2.486
+0.03
1.22%
jan 1, 1995
2.564
+0.078
3.14%
jan 1, 1996
2.668
+0.104
4.06%
jan 1, 1997
2.771
+0.103
3.86%
jan 1, 1998
2.851
+0.08
2.89%
jan 1, 1999
2.893
+0.042
1.47%
jan 1, 2000
2.89
-0.003
-0.1%
jan 1, 2001
2.847
-0.043
-1.49%
jan 1, 2002
2.778
-0.069
-2.42%
jan 1, 2003
2.707
-0.071
-2.56%
jan 1, 2004
2.648
-0.059
-2.18%
jan 1, 2005
2.605
-0.043
-1.62%
jan 1, 2006
2.577
-0.028
-1.07%
jan 1, 2007
2.554
-0.023
-0.89%
jan 1, 2008
2.525
-0.029
-1.14%
jan 1, 2009
2.481
-0.044
-1.74%
jan 1, 2010
2.423
-0.058
-2.34%
jan 1, 2011
2.353
-0.07
-2.89%
jan 1, 2012
2.279
-0.074
-3.14%
jan 1, 2013
2.209
-0.07
-3.07%
jan 1, 2014
2.15
-0.059
-2.67%
jan 1, 2015
2.105
-0.045
-2.09%
Ranking of countries by current statistics by years


Comments: