29
/
en
AIzaSyAYiBZKx7MnpbEhh9jyipgxe19OcubqV5w
April 1, 2024
113536
Cote d'Ivoire
CIV
true
2
1
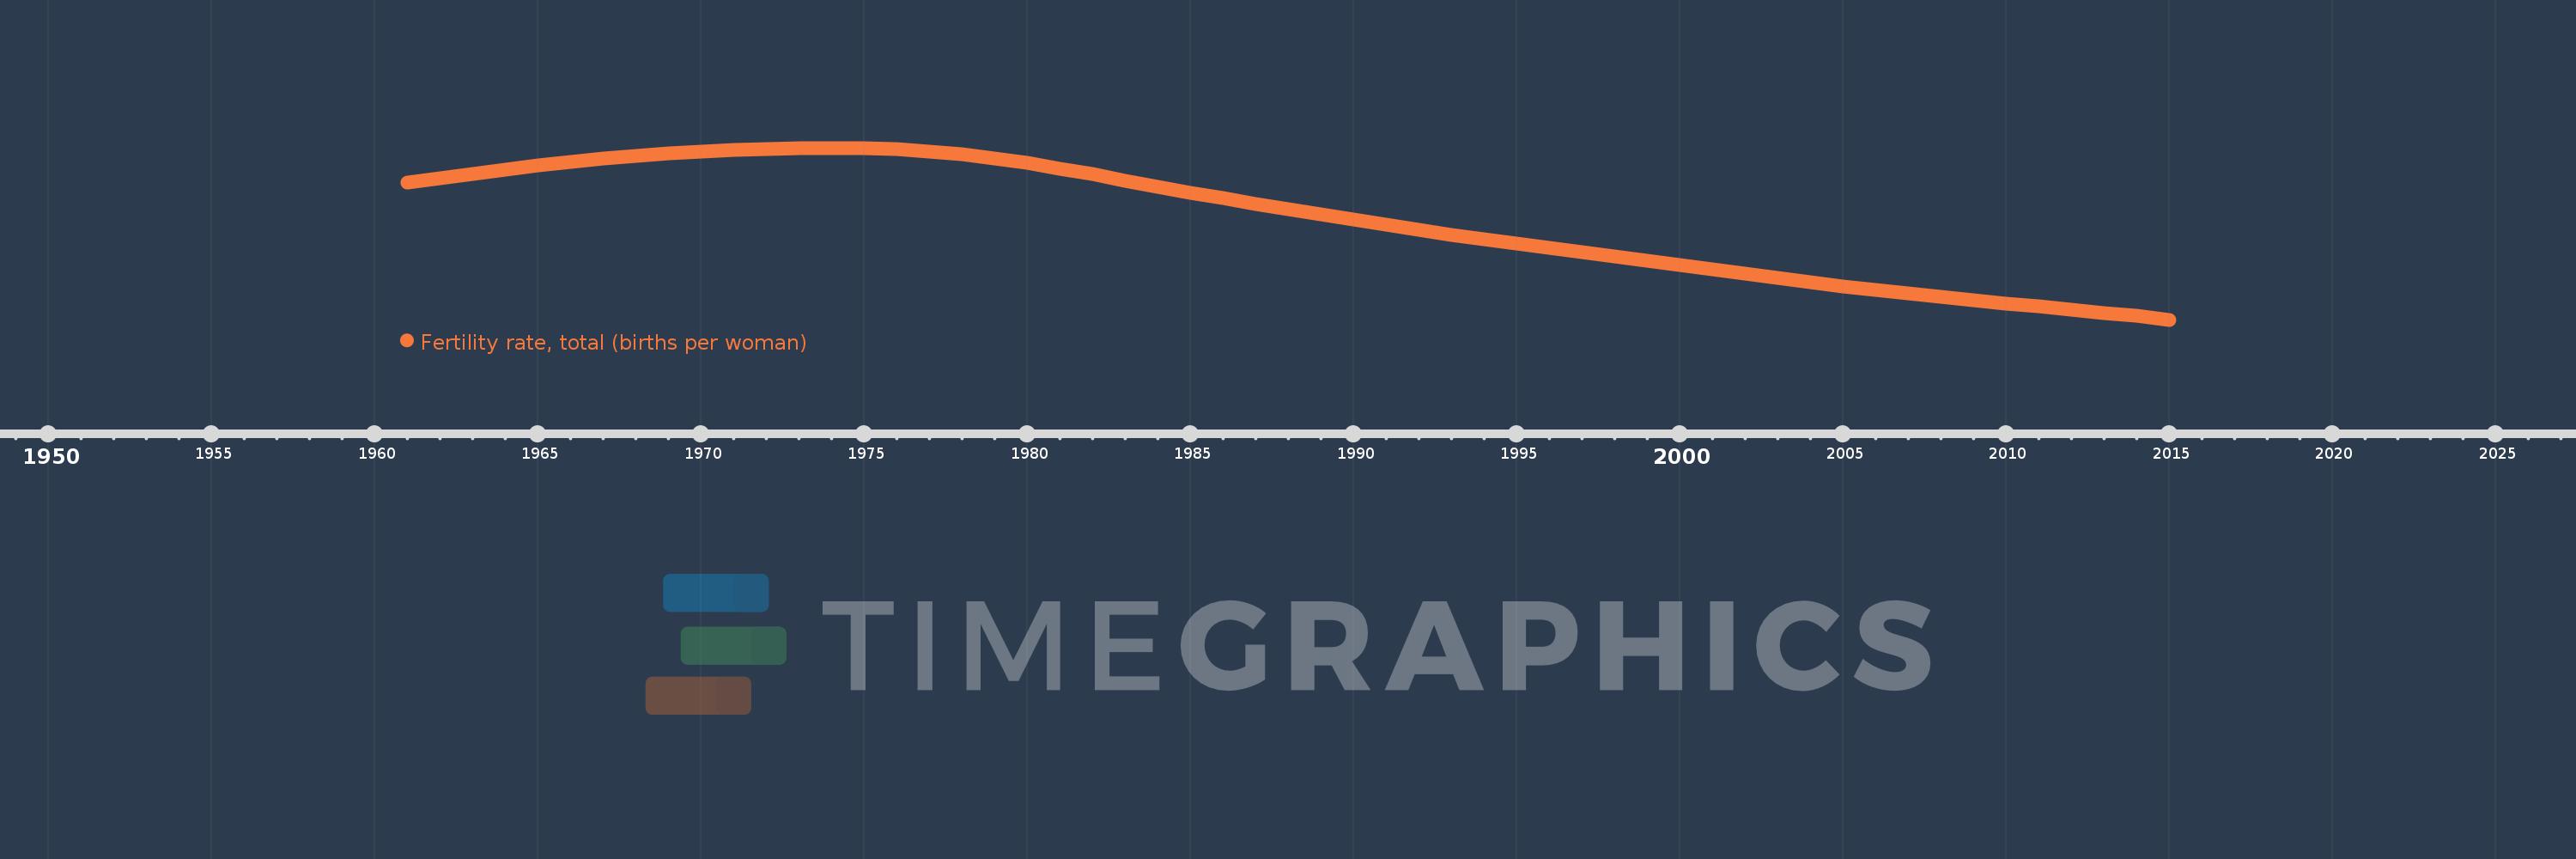
Fertility rate, total (births per woman)
2015,2014,2013,2012,2011,2010,2009,2008,2007,2006,2005,2004,2003,2002,2001,2000,1999,1998,1997,1996,1995,1994,1993,1992,1991,1990,1989,1988,1987,1986,1985,1984,1983,1982,1981,1980,1979,1978,1977,1976,1975,1974,1973,1972,1971,1970,1969,1968,1967,1966,1965,1964,1963,1962,1961
This statistics in other country:
AfghanistanAlbaniaAlgeriaAndorraAngolaAntigua and BarbudaArab WorldArgentinaArmeniaArubaAustraliaAustriaAzerbaijanBahamas, TheBahrainBangladeshBarbadosBelarusBelgiumBelizeBeninBermudaBhutanBoliviaBosnia and HerzegovinaBotswanaBrazilBrunei DarussalamBulgariaBurkina FasoBurundiCabo VerdeCambodiaCameroonCanadaCaribbean small statesCentral African RepublicCentral Europe and the BalticsChadChannel IslandsChileChinaColombiaComorosCongo, Dem. Rep.Congo, Rep.Costa RicaCote d'IvoireCroatiaCubaCuracaoCyprusCzech RepublicDenmarkDjiboutiDominicaDominican RepublicEarly-demographic dividendEast Asia & PacificEast Asia & Pacific (excluding high income)East Asia & Pacific (IDA & IBRD countries)EcuadorEgypt, Arab Rep.El SalvadorEquatorial GuineaEritreaEstoniaEthiopiaEuro areaEurope & Central AsiaEurope & Central Asia (excluding high income)Europe & Central Asia (IDA & IBRD countries)European UnionFaroe IslandsFijiFinlandFragile and conflict affected situationsFranceFrench PolynesiaGabonGambia, TheGeorgiaGermanyGhanaGreeceGreenlandGrenadaGuamGuatemalaGuineaGuinea-BissauGuyanaHaitiHeavily indebted poor countries (HIPC)High incomeHondurasHong Kong SAR, ChinaHungaryIBRD onlyIcelandIDA & IBRD totalIDA blendIDA onlyIDA totalIndiaIndonesiaIran, Islamic Rep.IraqIrelandIsle of ManIsraelItalyJamaicaJapanJordanKazakhstanKenyaKiribatiKorea, Dem. People’s Rep.Korea, Rep.KosovoKuwaitKyrgyz RepublicLao PDRLate-demographic dividendLatin America & Caribbean Latin America & Caribbean (excluding high income)Latin America & the Caribbean (IDA & IBRD countries)LatviaLeast developed countries: UN classificationLebanonLesothoLiberiaLibyaLiechtensteinLithuaniaLow & middle incomeLow incomeLower middle incomeLuxembourgMacao SAR, ChinaMacedonia, FYRMadagascarMalawiMalaysiaMaldivesMaliMaltaMarshall IslandsMauritaniaMauritiusMexicoMicronesia, Fed. Sts.Middle East & North AfricaMiddle East & North Africa (excluding high income)Middle East & North Africa (IDA & IBRD countries)Middle incomeMoldovaMongoliaMontenegroMoroccoMozambiqueMyanmarNamibiaNepalNetherlandsNew CaledoniaNew ZealandNicaraguaNigerNigeriaNorth AmericaNorwayOECD membersOmanOther small statesPacific island small statesPakistanPalauPanamaPapua New GuineaParaguayPeruPhilippinesPolandPortugalPost-demographic dividendPre-demographic dividendPuerto RicoQatarRomaniaRussian FederationRwandaSamoaSan MarinoSao Tome and PrincipeSaudi ArabiaSenegalSerbiaSeychellesSierra LeoneSingaporeSint Maarten (Dutch part)Slovak RepublicSloveniaSmall statesSolomon IslandsSomaliaSouth AfricaSouth AsiaSouth Asia (IDA & IBRD)South SudanSpainSri LankaSt. Kitts and NevisSt. LuciaSt. Martin (French part)St. Vincent and the GrenadinesSub-Saharan Africa Sub-Saharan Africa (excluding high income)Sub-Saharan Africa (IDA & IBRD countries)SudanSurinameSwazilandSwedenSwitzerlandSyrian Arab RepublicTajikistanTanzaniaThailandTimor-LesteTogoTongaTrinidad and TobagoTunisiaTurkeyTurkmenistanUgandaUkraineUnited Arab EmiratesUnited KingdomUnited StatesUpper middle incomeUruguayUzbekistanVanuatuVenezuela, RBVietnamVirgin Islands (U.S.)West Bank and GazaWorldYemen, Rep.ZambiaZimbabwe Timeline:
This timeline shows a graph from 1961 to 2015 of Cote d'Ivoire. No data until 1960. Number of actual observations by date: 55.
Source name:
World Development Indicators
Source organization:
(1) United Nations Population Division. World Population Prospects, (2) Census reports and other statistical publications from national statistical offices, (3) Eurostat: Demographic Statistics, (4) United Nations Statistical Division. Population and Vital Statistics Reprot (various years), (5) U.S. Census Bureau: International Database, and (6) Secretariat of the Pacific Community: Statistics and Demography Programme.
Categories, topics:
Health, Gender
Last updated:
apr 23, 2017
Indicators value changes by year
At the date of observation
Value
Absolute change
Change from previous value
jan 1, 1961
7.351
+7.351
0.0%
jan 1, 1962
7.427
+0.076
1.03%
jan 1, 1963
7.501
+0.074
1.0%
jan 1, 1964
7.572
+0.071
0.95%
jan 1, 1965
7.639
+0.067
0.88%
jan 1, 1966
7.701
+0.062
0.81%
jan 1, 1967
7.757
+0.056
0.73%
jan 1, 1968
7.806
+0.049
0.63%
jan 1, 1969
7.849
+0.043
0.55%
jan 1, 1970
7.883
+0.034
0.43%
jan 1, 1971
7.908
+0.025
0.32%
jan 1, 1972
7.927
+0.019
0.24%
jan 1, 1973
7.937
+0.01
0.13%
jan 1, 1974
7.94
+0.003
0.04%
jan 1, 1975
7.934
-0.006
-0.08%
jan 1, 1976
7.916
-0.018
-0.23%
jan 1, 1977
7.882
-0.034
-0.43%
jan 1, 1978
7.832
-0.05
-0.63%
jan 1, 1979
7.765
-0.067
-0.86%
jan 1, 1980
7.683
-0.082
-1.06%
jan 1, 1981
7.59
-0.093
-1.21%
jan 1, 1982
7.488
-0.102
-1.34%
jan 1, 1983
7.383
-0.105
-1.4%
jan 1, 1984
7.278
-0.105
-1.42%
jan 1, 1985
7.176
-0.102
-1.4%
jan 1, 1986
7.078
-0.098
-1.37%
jan 1, 1987
6.984
-0.094
-1.33%
jan 1, 1988
6.892
-0.092
-1.32%
jan 1, 1989
6.801
-0.091
-1.32%
jan 1, 1990
6.71
-0.091
-1.34%
jan 1, 1991
6.622
-0.088
-1.31%
jan 1, 1992
6.536
-0.086
-1.3%
jan 1, 1993
6.454
-0.082
-1.25%
jan 1, 1994
6.374
-0.08
-1.24%
jan 1, 1995
6.298
-0.076
-1.19%
jan 1, 1996
6.224
-0.074
-1.17%
jan 1, 1997
6.152
-0.072
-1.16%
jan 1, 1998
6.08
-0.072
-1.17%
jan 1, 1999
6.008
-0.072
-1.18%
jan 1, 2000
5.935
-0.073
-1.22%
jan 1, 2001
5.861
-0.074
-1.25%
jan 1, 2002
5.788
-0.073
-1.25%
jan 1, 2003
5.716
-0.072
-1.24%
jan 1, 2004
5.645
-0.071
-1.24%
jan 1, 2005
5.577
-0.068
-1.2%
jan 1, 2006
5.512
-0.065
-1.17%
jan 1, 2007
5.45
-0.062
-1.12%
jan 1, 2008
5.392
-0.058
-1.06%
jan 1, 2009
5.337
-0.055
-1.02%
jan 1, 2010
5.283
-0.054
-1.01%
jan 1, 2011
5.231
-0.052
-0.98%
jan 1, 2012
5.177
-0.054
-1.03%
jan 1, 2013
5.121
-0.056
-1.08%
jan 1, 2014
5.063
-0.058
-1.13%
jan 1, 2015
5.001
-0.062
-1.22%
Ranking of countries by current statistics by years


Comments: