29
/
en
AIzaSyAYiBZKx7MnpbEhh9jyipgxe19OcubqV5w
April 1, 2024
222133
Peru
PER
true
2
1
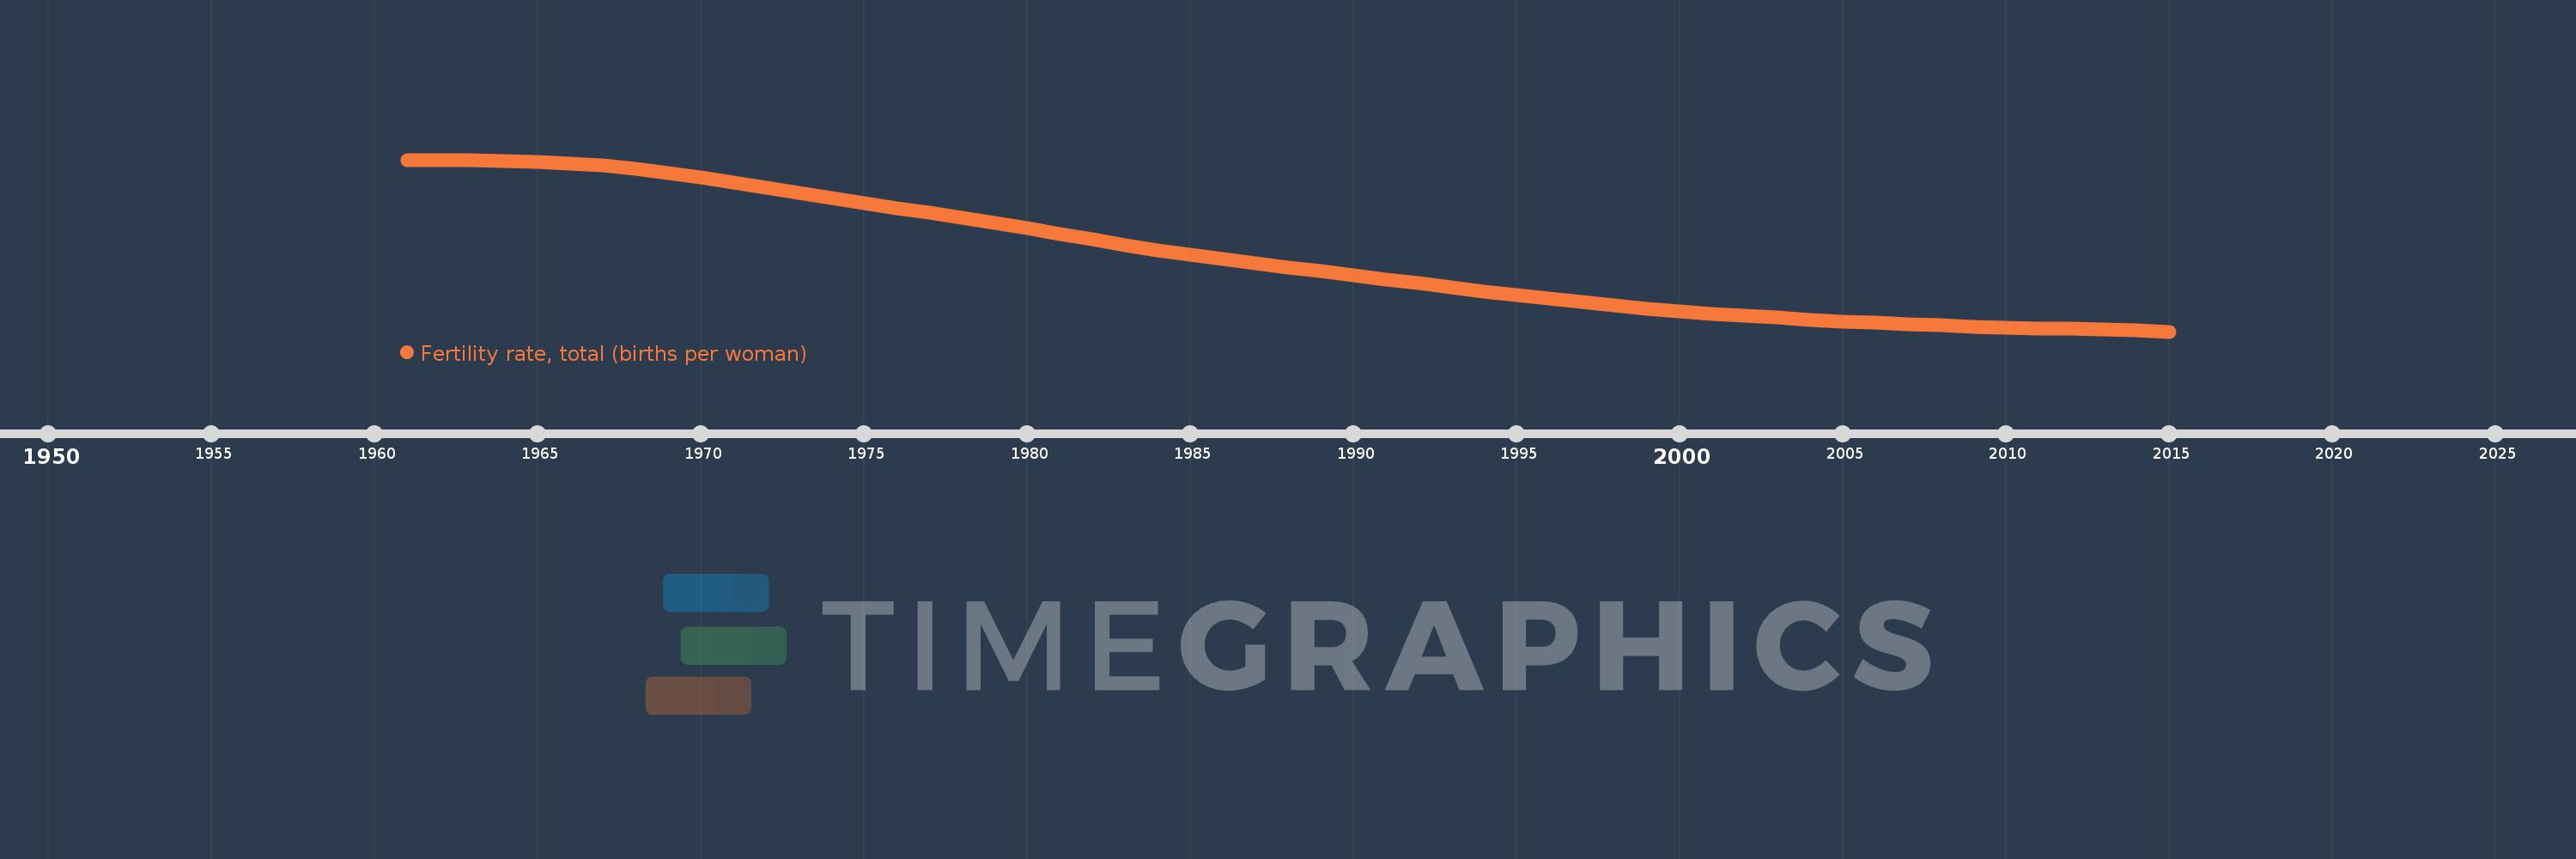
Fertility rate, total (births per woman)
2015,2014,2013,2012,2011,2010,2009,2008,2007,2006,2005,2004,2003,2002,2001,2000,1999,1998,1997,1996,1995,1994,1993,1992,1991,1990,1989,1988,1987,1986,1985,1984,1983,1982,1981,1980,1979,1978,1977,1976,1975,1974,1973,1972,1971,1970,1969,1968,1967,1966,1965,1964,1963,1962,1961
This statistics in other country:
AfghanistanAlbaniaAlgeriaAndorraAngolaAntigua and BarbudaArab WorldArgentinaArmeniaArubaAustraliaAustriaAzerbaijanBahamas, TheBahrainBangladeshBarbadosBelarusBelgiumBelizeBeninBermudaBhutanBoliviaBosnia and HerzegovinaBotswanaBrazilBrunei DarussalamBulgariaBurkina FasoBurundiCabo VerdeCambodiaCameroonCanadaCaribbean small statesCentral African RepublicCentral Europe and the BalticsChadChannel IslandsChileChinaColombiaComorosCongo, Dem. Rep.Congo, Rep.Costa RicaCote d'IvoireCroatiaCubaCuracaoCyprusCzech RepublicDenmarkDjiboutiDominicaDominican RepublicEarly-demographic dividendEast Asia & PacificEast Asia & Pacific (excluding high income)East Asia & Pacific (IDA & IBRD countries)EcuadorEgypt, Arab Rep.El SalvadorEquatorial GuineaEritreaEstoniaEthiopiaEuro areaEurope & Central AsiaEurope & Central Asia (excluding high income)Europe & Central Asia (IDA & IBRD countries)European UnionFaroe IslandsFijiFinlandFragile and conflict affected situationsFranceFrench PolynesiaGabonGambia, TheGeorgiaGermanyGhanaGreeceGreenlandGrenadaGuamGuatemalaGuineaGuinea-BissauGuyanaHaitiHeavily indebted poor countries (HIPC)High incomeHondurasHong Kong SAR, ChinaHungaryIBRD onlyIcelandIDA & IBRD totalIDA blendIDA onlyIDA totalIndiaIndonesiaIran, Islamic Rep.IraqIrelandIsle of ManIsraelItalyJamaicaJapanJordanKazakhstanKenyaKiribatiKorea, Dem. People’s Rep.Korea, Rep.KosovoKuwaitKyrgyz RepublicLao PDRLate-demographic dividendLatin America & Caribbean Latin America & Caribbean (excluding high income)Latin America & the Caribbean (IDA & IBRD countries)LatviaLeast developed countries: UN classificationLebanonLesothoLiberiaLibyaLiechtensteinLithuaniaLow & middle incomeLow incomeLower middle incomeLuxembourgMacao SAR, ChinaMacedonia, FYRMadagascarMalawiMalaysiaMaldivesMaliMaltaMarshall IslandsMauritaniaMauritiusMexicoMicronesia, Fed. Sts.Middle East & North AfricaMiddle East & North Africa (excluding high income)Middle East & North Africa (IDA & IBRD countries)Middle incomeMoldovaMongoliaMontenegroMoroccoMozambiqueMyanmarNamibiaNepalNetherlandsNew CaledoniaNew ZealandNicaraguaNigerNigeriaNorth AmericaNorwayOECD membersOmanOther small statesPacific island small statesPakistanPalauPanamaPapua New GuineaParaguayPeruPhilippinesPolandPortugalPost-demographic dividendPre-demographic dividendPuerto RicoQatarRomaniaRussian FederationRwandaSamoaSan MarinoSao Tome and PrincipeSaudi ArabiaSenegalSerbiaSeychellesSierra LeoneSingaporeSint Maarten (Dutch part)Slovak RepublicSloveniaSmall statesSolomon IslandsSomaliaSouth AfricaSouth AsiaSouth Asia (IDA & IBRD)South SudanSpainSri LankaSt. Kitts and NevisSt. LuciaSt. Martin (French part)St. Vincent and the GrenadinesSub-Saharan Africa Sub-Saharan Africa (excluding high income)Sub-Saharan Africa (IDA & IBRD countries)SudanSurinameSwazilandSwedenSwitzerlandSyrian Arab RepublicTajikistanTanzaniaThailandTimor-LesteTogoTongaTrinidad and TobagoTunisiaTurkeyTurkmenistanUgandaUkraineUnited Arab EmiratesUnited KingdomUnited StatesUpper middle incomeUruguayUzbekistanVanuatuVenezuela, RBVietnamVirgin Islands (U.S.)West Bank and GazaWorldYemen, Rep.ZambiaZimbabwe Timeline:
This timeline shows a graph from 1961 to 2015 of Peru. No data until 1960. Number of actual observations by date: 55.
Source name:
World Development Indicators
Source organization:
(1) United Nations Population Division. World Population Prospects, (2) Census reports and other statistical publications from national statistical offices, (3) Eurostat: Demographic Statistics, (4) United Nations Statistical Division. Population and Vital Statistics Reprot (various years), (5) U.S. Census Bureau: International Database, and (6) Secretariat of the Pacific Community: Statistics and Demography Programme.
Categories, topics:
Health, Gender
Last updated:
apr 23, 2017
Indicators value changes by year
At the date of observation
Value
Absolute change
Change from previous value
jan 1, 1961
6.971
+6.971
0.0%
jan 1, 1962
6.97
-0.001
-0.01%
jan 1, 1963
6.963
-0.007
-0.1%
jan 1, 1964
6.948
-0.015
-0.22%
jan 1, 1965
6.921
-0.027
-0.39%
jan 1, 1966
6.878
-0.043
-0.62%
jan 1, 1967
6.816
-0.062
-0.9%
jan 1, 1968
6.733
-0.083
-1.22%
jan 1, 1969
6.63
-0.103
-1.53%
jan 1, 1970
6.51
-0.12
-1.81%
jan 1, 1971
6.378
-0.132
-2.03%
jan 1, 1972
6.239
-0.139
-2.18%
jan 1, 1973
6.099
-0.14
-2.24%
jan 1, 1974
5.963
-0.136
-2.23%
jan 1, 1975
5.832
-0.131
-2.2%
jan 1, 1976
5.705
-0.127
-2.18%
jan 1, 1977
5.578
-0.127
-2.23%
jan 1, 1978
5.447
-0.131
-2.35%
jan 1, 1979
5.31
-0.137
-2.52%
jan 1, 1980
5.167
-0.143
-2.69%
jan 1, 1981
5.021
-0.146
-2.83%
jan 1, 1982
4.875
-0.146
-2.91%
jan 1, 1983
4.733
-0.142
-2.91%
jan 1, 1984
4.6
-0.133
-2.81%
jan 1, 1985
4.475
-0.125
-2.72%
jan 1, 1986
4.358
-0.117
-2.61%
jan 1, 1987
4.249
-0.109
-2.5%
jan 1, 1988
4.142
-0.107
-2.52%
jan 1, 1989
4.037
-0.105
-2.54%
jan 1, 1990
3.933
-0.104
-2.58%
jan 1, 1991
3.828
-0.105
-2.67%
jan 1, 1992
3.722
-0.106
-2.77%
jan 1, 1993
3.617
-0.105
-2.82%
jan 1, 1994
3.514
-0.103
-2.85%
jan 1, 1995
3.413
-0.101
-2.87%
jan 1, 1996
3.317
-0.096
-2.81%
jan 1, 1997
3.226
-0.091
-2.74%
jan 1, 1998
3.142
-0.084
-2.6%
jan 1, 1999
3.064
-0.078
-2.48%
jan 1, 2000
2.993
-0.071
-2.32%
jan 1, 2001
2.929
-0.064
-2.14%
jan 1, 2002
2.871
-0.058
-1.98%
jan 1, 2003
2.818
-0.053
-1.85%
jan 1, 2004
2.77
-0.048
-1.7%
jan 1, 2005
2.725
-0.045
-1.62%
jan 1, 2006
2.684
-0.041
-1.5%
jan 1, 2007
2.648
-0.036
-1.34%
jan 1, 2008
2.616
-0.032
-1.21%
jan 1, 2009
2.59
-0.026
-0.99%
jan 1, 2010
2.566
-0.024
-0.93%
jan 1, 2011
2.545
-0.021
-0.82%
jan 1, 2012
2.525
-0.02
-0.79%
jan 1, 2013
2.504
-0.021
-0.83%
jan 1, 2014
2.48
-0.024
-0.96%
jan 1, 2015
2.455
-0.025
-1.01%
Ranking of countries by current statistics by years


Comments: