29
/
en
AIzaSyAYiBZKx7MnpbEhh9jyipgxe19OcubqV5w
April 1, 2024
255128
Swaziland
SWZ
true
2
1
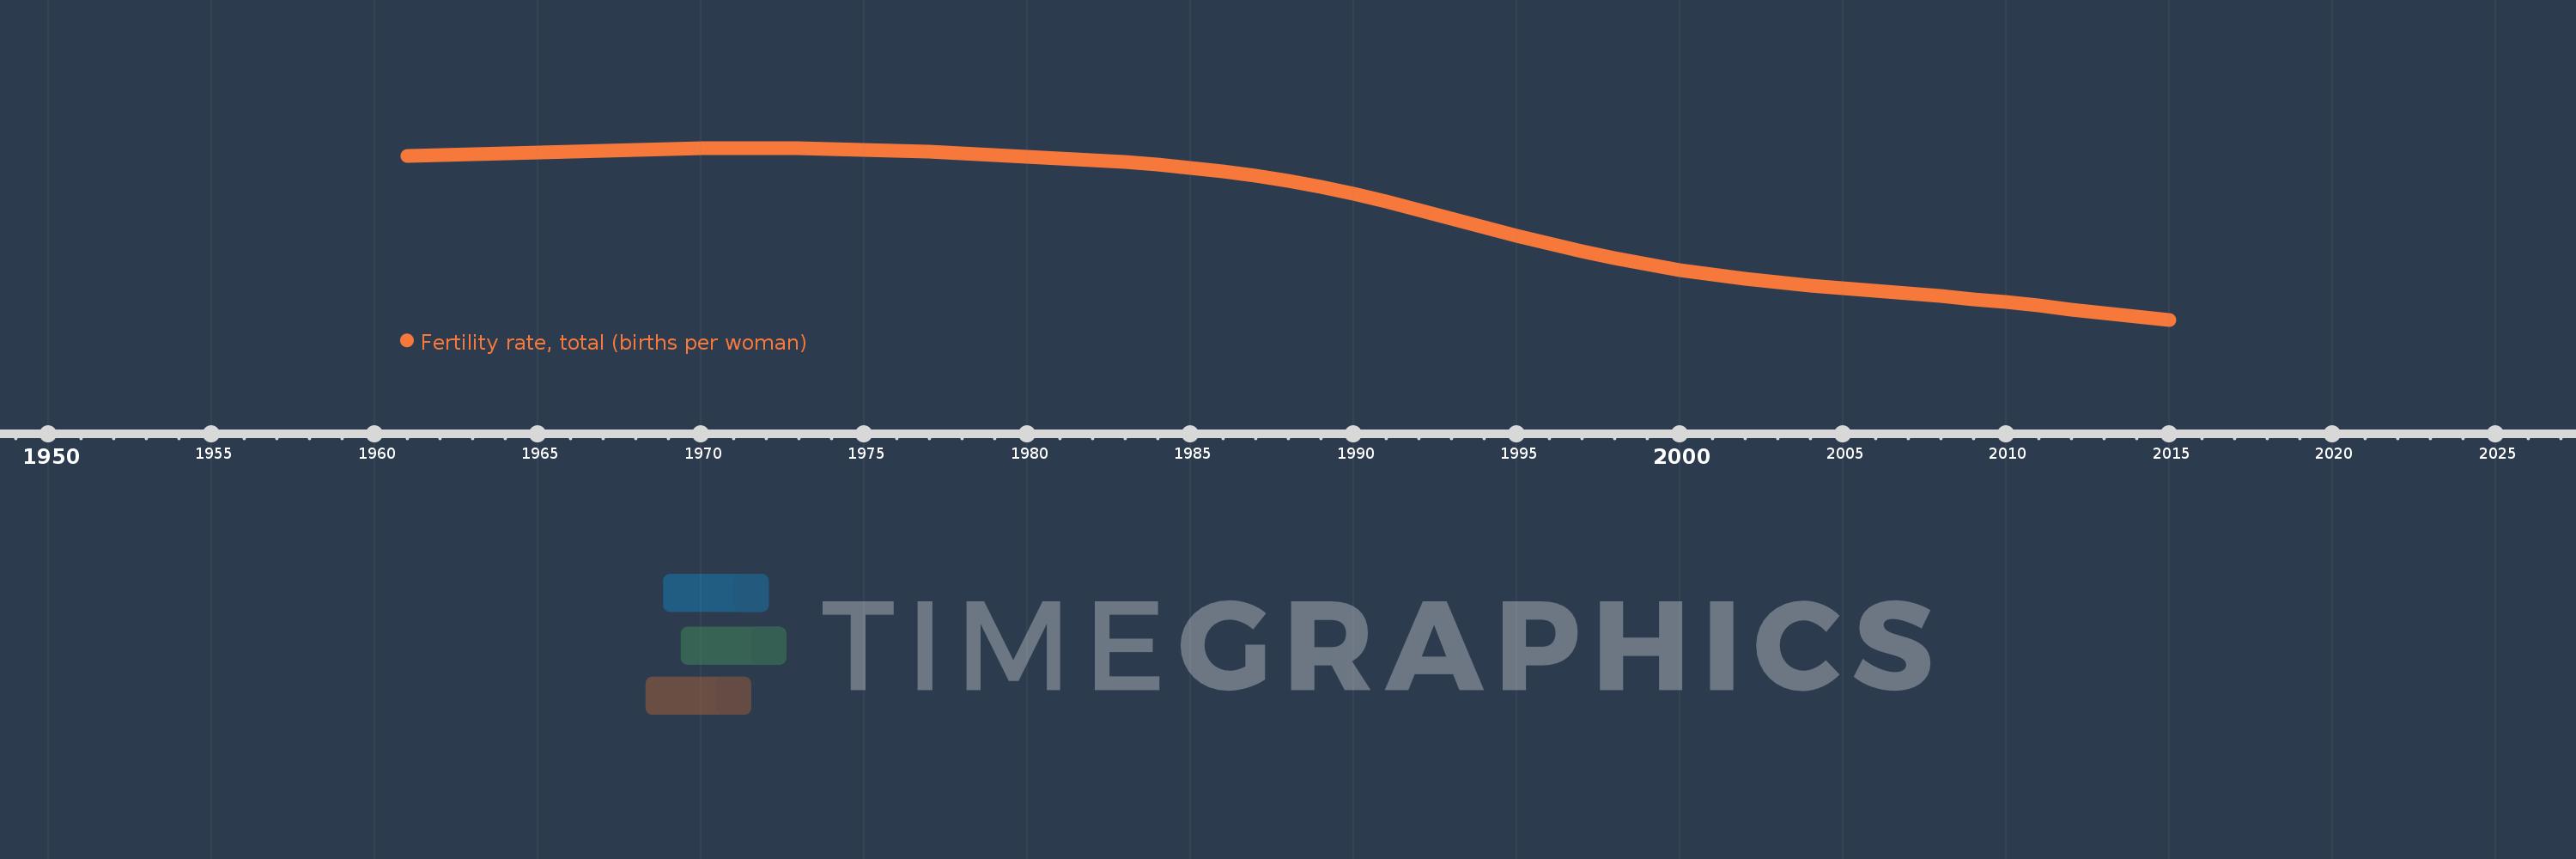
Fertility rate, total (births per woman)
2015,2014,2013,2012,2011,2010,2009,2008,2007,2006,2005,2004,2003,2002,2001,2000,1999,1998,1997,1996,1995,1994,1993,1992,1991,1990,1989,1988,1987,1986,1985,1984,1983,1982,1981,1980,1979,1978,1977,1976,1975,1974,1973,1972,1971,1970,1969,1968,1967,1966,1965,1964,1963,1962,1961
This statistics in other country:
AfghanistanAlbaniaAlgeriaAndorraAngolaAntigua and BarbudaArab WorldArgentinaArmeniaArubaAustraliaAustriaAzerbaijanBahamas, TheBahrainBangladeshBarbadosBelarusBelgiumBelizeBeninBermudaBhutanBoliviaBosnia and HerzegovinaBotswanaBrazilBrunei DarussalamBulgariaBurkina FasoBurundiCabo VerdeCambodiaCameroonCanadaCaribbean small statesCentral African RepublicCentral Europe and the BalticsChadChannel IslandsChileChinaColombiaComorosCongo, Dem. Rep.Congo, Rep.Costa RicaCote d'IvoireCroatiaCubaCuracaoCyprusCzech RepublicDenmarkDjiboutiDominicaDominican RepublicEarly-demographic dividendEast Asia & PacificEast Asia & Pacific (excluding high income)East Asia & Pacific (IDA & IBRD countries)EcuadorEgypt, Arab Rep.El SalvadorEquatorial GuineaEritreaEstoniaEthiopiaEuro areaEurope & Central AsiaEurope & Central Asia (excluding high income)Europe & Central Asia (IDA & IBRD countries)European UnionFaroe IslandsFijiFinlandFragile and conflict affected situationsFranceFrench PolynesiaGabonGambia, TheGeorgiaGermanyGhanaGreeceGreenlandGrenadaGuamGuatemalaGuineaGuinea-BissauGuyanaHaitiHeavily indebted poor countries (HIPC)High incomeHondurasHong Kong SAR, ChinaHungaryIBRD onlyIcelandIDA & IBRD totalIDA blendIDA onlyIDA totalIndiaIndonesiaIran, Islamic Rep.IraqIrelandIsle of ManIsraelItalyJamaicaJapanJordanKazakhstanKenyaKiribatiKorea, Dem. People’s Rep.Korea, Rep.KosovoKuwaitKyrgyz RepublicLao PDRLate-demographic dividendLatin America & Caribbean Latin America & Caribbean (excluding high income)Latin America & the Caribbean (IDA & IBRD countries)LatviaLeast developed countries: UN classificationLebanonLesothoLiberiaLibyaLiechtensteinLithuaniaLow & middle incomeLow incomeLower middle incomeLuxembourgMacao SAR, ChinaMacedonia, FYRMadagascarMalawiMalaysiaMaldivesMaliMaltaMarshall IslandsMauritaniaMauritiusMexicoMicronesia, Fed. Sts.Middle East & North AfricaMiddle East & North Africa (excluding high income)Middle East & North Africa (IDA & IBRD countries)Middle incomeMoldovaMongoliaMontenegroMoroccoMozambiqueMyanmarNamibiaNepalNetherlandsNew CaledoniaNew ZealandNicaraguaNigerNigeriaNorth AmericaNorwayOECD membersOmanOther small statesPacific island small statesPakistanPalauPanamaPapua New GuineaParaguayPeruPhilippinesPolandPortugalPost-demographic dividendPre-demographic dividendPuerto RicoQatarRomaniaRussian FederationRwandaSamoaSan MarinoSao Tome and PrincipeSaudi ArabiaSenegalSerbiaSeychellesSierra LeoneSingaporeSint Maarten (Dutch part)Slovak RepublicSloveniaSmall statesSolomon IslandsSomaliaSouth AfricaSouth AsiaSouth Asia (IDA & IBRD)South SudanSpainSri LankaSt. Kitts and NevisSt. LuciaSt. Martin (French part)St. Vincent and the GrenadinesSub-Saharan Africa Sub-Saharan Africa (excluding high income)Sub-Saharan Africa (IDA & IBRD countries)SudanSurinameSwazilandSwedenSwitzerlandSyrian Arab RepublicTajikistanTanzaniaThailandTimor-LesteTogoTongaTrinidad and TobagoTunisiaTurkeyTurkmenistanUgandaUkraineUnited Arab EmiratesUnited KingdomUnited StatesUpper middle incomeUruguayUzbekistanVanuatuVenezuela, RBVietnamVirgin Islands (U.S.)West Bank and GazaWorldYemen, Rep.ZambiaZimbabwe Timeline:
This timeline shows a graph from 1961 to 2015 of Swaziland. No data until 1960. Number of actual observations by date: 55.
Source name:
World Development Indicators
Source organization:
(1) United Nations Population Division. World Population Prospects, (2) Census reports and other statistical publications from national statistical offices, (3) Eurostat: Demographic Statistics, (4) United Nations Statistical Division. Population and Vital Statistics Reprot (various years), (5) U.S. Census Bureau: International Database, and (6) Secretariat of the Pacific Community: Statistics and Demography Programme.
Categories, topics:
Health, Gender
Last updated:
apr 23, 2017
Indicators value changes by year
At the date of observation
Value
Absolute change
Change from previous value
jan 1, 1961
6.717
+6.717
0.0%
jan 1, 1962
6.73
+0.013
0.19%
jan 1, 1963
6.745
+0.015
0.22%
jan 1, 1964
6.763
+0.018
0.27%
jan 1, 1965
6.782
+0.019
0.28%
jan 1, 1966
6.802
+0.02
0.29%
jan 1, 1967
6.822
+0.02
0.29%
jan 1, 1968
6.841
+0.019
0.28%
jan 1, 1969
6.857
+0.016
0.23%
jan 1, 1970
6.869
+0.012
0.18%
jan 1, 1971
6.875
+0.006
0.09%
jan 1, 1972
6.876
+0.001
0.01%
jan 1, 1973
6.87
-0.006
-0.09%
jan 1, 1974
6.858
-0.012
-0.17%
jan 1, 1975
6.84
-0.018
-0.26%
jan 1, 1976
6.817
-0.023
-0.34%
jan 1, 1977
6.79
-0.027
-0.4%
jan 1, 1978
6.761
-0.029
-0.43%
jan 1, 1979
6.729
-0.032
-0.47%
jan 1, 1980
6.695
-0.034
-0.51%
jan 1, 1981
6.658
-0.037
-0.55%
jan 1, 1982
6.618
-0.04
-0.6%
jan 1, 1983
6.573
-0.045
-0.68%
jan 1, 1984
6.52
-0.053
-0.81%
jan 1, 1985
6.459
-0.061
-0.94%
jan 1, 1986
6.384
-0.075
-1.16%
jan 1, 1987
6.291
-0.093
-1.46%
jan 1, 1988
6.18
-0.111
-1.76%
jan 1, 1989
6.051
-0.129
-2.09%
jan 1, 1990
5.905
-0.146
-2.41%
jan 1, 1991
5.744
-0.161
-2.73%
jan 1, 1992
5.571
-0.173
-3.01%
jan 1, 1993
5.392
-0.179
-3.21%
jan 1, 1994
5.211
-0.181
-3.36%
jan 1, 1995
5.035
-0.176
-3.38%
jan 1, 1996
4.866
-0.169
-3.36%
jan 1, 1997
4.709
-0.157
-3.23%
jan 1, 1998
4.564
-0.145
-3.08%
jan 1, 1999
4.432
-0.132
-2.89%
jan 1, 2000
4.313
-0.119
-2.69%
jan 1, 2001
4.209
-0.104
-2.41%
jan 1, 2002
4.121
-0.088
-2.09%
jan 1, 2003
4.046
-0.075
-1.82%
jan 1, 2004
3.982
-0.064
-1.58%
jan 1, 2005
3.925
-0.057
-1.43%
jan 1, 2006
3.871
-0.054
-1.38%
jan 1, 2007
3.818
-0.053
-1.37%
jan 1, 2008
3.761
-0.057
-1.49%
jan 1, 2009
3.699
-0.062
-1.65%
jan 1, 2010
3.632
-0.067
-1.81%
jan 1, 2011
3.559
-0.073
-2.01%
jan 1, 2012
3.483
-0.076
-2.14%
jan 1, 2013
3.407
-0.076
-2.18%
jan 1, 2014
3.334
-0.073
-2.14%
jan 1, 2015
3.266
-0.068
-2.04%
Ranking of countries by current statistics by years


Comments: