29
/
en
AIzaSyAYiBZKx7MnpbEhh9jyipgxe19OcubqV5w
April 1, 2024
32571
Europe & Central Asia (IDA & IBRD countries)
TEC
false
2
1
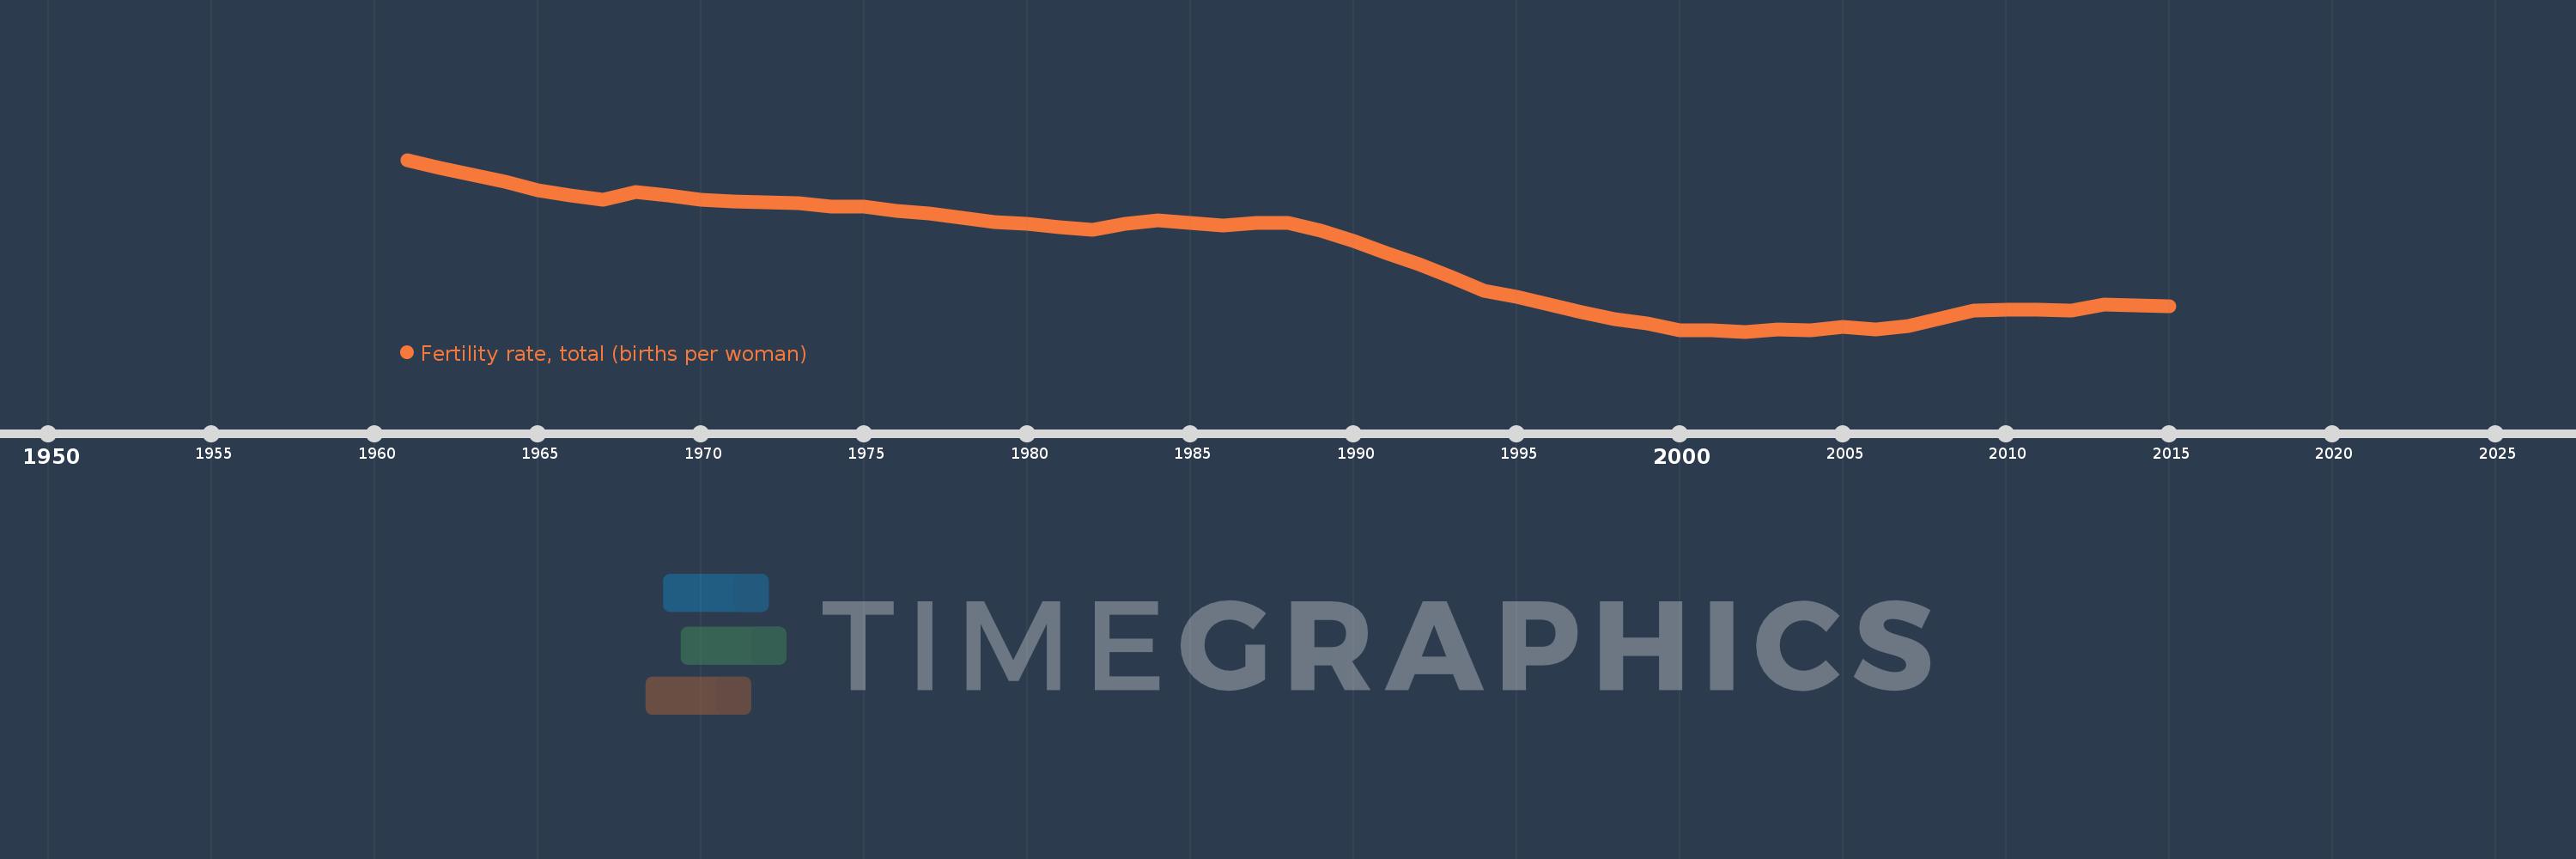
Fertility rate, total (births per woman)
2015,2014,2013,2012,2011,2010,2009,2008,2007,2006,2005,2004,2003,2002,2001,2000,1999,1998,1997,1996,1995,1994,1993,1992,1991,1990,1989,1988,1987,1986,1985,1984,1983,1982,1981,1980,1979,1978,1977,1976,1975,1974,1973,1972,1971,1970,1969,1968,1967,1966,1965,1964,1963,1962,1961
This statistics in other country:
AfghanistanAlbaniaAlgeriaAndorraAngolaAntigua and BarbudaArab WorldArgentinaArmeniaArubaAustraliaAustriaAzerbaijanBahamas, TheBahrainBangladeshBarbadosBelarusBelgiumBelizeBeninBermudaBhutanBoliviaBosnia and HerzegovinaBotswanaBrazilBrunei DarussalamBulgariaBurkina FasoBurundiCabo VerdeCambodiaCameroonCanadaCaribbean small statesCentral African RepublicCentral Europe and the BalticsChadChannel IslandsChileChinaColombiaComorosCongo, Dem. Rep.Congo, Rep.Costa RicaCote d'IvoireCroatiaCubaCuracaoCyprusCzech RepublicDenmarkDjiboutiDominicaDominican RepublicEarly-demographic dividendEast Asia & PacificEast Asia & Pacific (excluding high income)East Asia & Pacific (IDA & IBRD countries)EcuadorEgypt, Arab Rep.El SalvadorEquatorial GuineaEritreaEstoniaEthiopiaEuro areaEurope & Central AsiaEurope & Central Asia (excluding high income)Europe & Central Asia (IDA & IBRD countries)European UnionFaroe IslandsFijiFinlandFragile and conflict affected situationsFranceFrench PolynesiaGabonGambia, TheGeorgiaGermanyGhanaGreeceGreenlandGrenadaGuamGuatemalaGuineaGuinea-BissauGuyanaHaitiHeavily indebted poor countries (HIPC)High incomeHondurasHong Kong SAR, ChinaHungaryIBRD onlyIcelandIDA & IBRD totalIDA blendIDA onlyIDA totalIndiaIndonesiaIran, Islamic Rep.IraqIrelandIsle of ManIsraelItalyJamaicaJapanJordanKazakhstanKenyaKiribatiKorea, Dem. People’s Rep.Korea, Rep.KosovoKuwaitKyrgyz RepublicLao PDRLate-demographic dividendLatin America & Caribbean Latin America & Caribbean (excluding high income)Latin America & the Caribbean (IDA & IBRD countries)LatviaLeast developed countries: UN classificationLebanonLesothoLiberiaLibyaLiechtensteinLithuaniaLow & middle incomeLow incomeLower middle incomeLuxembourgMacao SAR, ChinaMacedonia, FYRMadagascarMalawiMalaysiaMaldivesMaliMaltaMarshall IslandsMauritaniaMauritiusMexicoMicronesia, Fed. Sts.Middle East & North AfricaMiddle East & North Africa (excluding high income)Middle East & North Africa (IDA & IBRD countries)Middle incomeMoldovaMongoliaMontenegroMoroccoMozambiqueMyanmarNamibiaNepalNetherlandsNew CaledoniaNew ZealandNicaraguaNigerNigeriaNorth AmericaNorwayOECD membersOmanOther small statesPacific island small statesPakistanPalauPanamaPapua New GuineaParaguayPeruPhilippinesPolandPortugalPost-demographic dividendPre-demographic dividendPuerto RicoQatarRomaniaRussian FederationRwandaSamoaSan MarinoSao Tome and PrincipeSaudi ArabiaSenegalSerbiaSeychellesSierra LeoneSingaporeSint Maarten (Dutch part)Slovak RepublicSloveniaSmall statesSolomon IslandsSomaliaSouth AfricaSouth AsiaSouth Asia (IDA & IBRD)South SudanSpainSri LankaSt. Kitts and NevisSt. LuciaSt. Martin (French part)St. Vincent and the GrenadinesSub-Saharan Africa Sub-Saharan Africa (excluding high income)Sub-Saharan Africa (IDA & IBRD countries)SudanSurinameSwazilandSwedenSwitzerlandSyrian Arab RepublicTajikistanTanzaniaThailandTimor-LesteTogoTongaTrinidad and TobagoTunisiaTurkeyTurkmenistanUgandaUkraineUnited Arab EmiratesUnited KingdomUnited StatesUpper middle incomeUruguayUzbekistanVanuatuVenezuela, RBVietnamVirgin Islands (U.S.)West Bank and GazaWorldYemen, Rep.ZambiaZimbabwe Timeline:
This timeline shows a graph from 1961 to 2015 of Europe & Central Asia (IDA & IBRD countries). No data until 1960. Number of actual observations by date: 55.
Source name:
World Development Indicators
Source organization:
(1) United Nations Population Division. World Population Prospects, (2) Census reports and other statistical publications from national statistical offices, (3) Eurostat: Demographic Statistics, (4) United Nations Statistical Division. Population and Vital Statistics Reprot (various years), (5) U.S. Census Bureau: International Database, and (6) Secretariat of the Pacific Community: Statistics and Demography Programme.
Categories, topics:
Health, Gender
Last updated:
apr 23, 2017
Indicators value changes by year
At the date of observation
Value
Absolute change
Change from previous value
jan 1, 1961
3.124
+3.124
0.0%
jan 1, 1962
3.049
-0.076
-2.42%
jan 1, 1963
2.995
-0.054
-1.76%
jan 1, 1964
2.932
-0.063
-2.1%
jan 1, 1965
2.852
-0.08
-2.72%
jan 1, 1966
2.813
-0.039
-1.37%
jan 1, 1967
2.775
-0.038
-1.34%
jan 1, 1968
2.842
+0.067
2.4%
jan 1, 1969
2.806
-0.036
-1.27%
jan 1, 1970
2.768
-0.038
-1.36%
jan 1, 1971
2.758
-0.009
-0.34%
jan 1, 1972
2.752
-0.006
-0.23%
jan 1, 1973
2.74
-0.012
-0.42%
jan 1, 1974
2.709
-0.031
-1.14%
jan 1, 1975
2.709
+0.0
0.01%
jan 1, 1976
2.674
-0.035
-1.29%
jan 1, 1977
2.648
-0.027
-1.0%
jan 1, 1978
2.609
-0.039
-1.46%
jan 1, 1979
2.577
-0.032
-1.23%
jan 1, 1980
2.559
-0.018
-0.68%
jan 1, 1981
2.53
-0.029
-1.15%
jan 1, 1982
2.507
-0.023
-0.9%
jan 1, 1983
2.559
+0.051
2.05%
jan 1, 1984
2.589
+0.03
1.19%
jan 1, 1985
2.567
-0.023
-0.87%
jan 1, 1986
2.543
-0.024
-0.94%
jan 1, 1987
2.565
+0.023
0.9%
jan 1, 1988
2.568
+0.003
0.11%
jan 1, 1989
2.499
-0.069
-2.69%
jan 1, 1990
2.406
-0.093
-3.73%
jan 1, 1991
2.302
-0.104
-4.31%
jan 1, 1992
2.203
-0.099
-4.29%
jan 1, 1993
2.088
-0.116
-5.26%
jan 1, 1994
1.965
-0.122
-5.87%
jan 1, 1995
1.916
-0.049
-2.51%
jan 1, 1996
1.848
-0.068
-3.55%
jan 1, 1997
1.78
-0.068
-3.67%
jan 1, 1998
1.716
-0.064
-3.59%
jan 1, 1999
1.677
-0.039
-2.29%
jan 1, 2000
1.622
-0.055
-3.28%
jan 1, 2001
1.617
-0.004
-0.27%
jan 1, 2002
1.608
-0.01
-0.59%
jan 1, 2003
1.624
+0.016
1.01%
jan 1, 2004
1.622
-0.002
-0.15%
jan 1, 2005
1.65
+0.028
1.74%
jan 1, 2006
1.629
-0.021
-1.25%
jan 1, 2007
1.657
+0.028
1.7%
jan 1, 2008
1.722
+0.065
3.91%
jan 1, 2009
1.791
+0.069
4.03%
jan 1, 2010
1.803
+0.012
0.68%
jan 1, 2011
1.802
-0.001
-0.05%
jan 1, 2012
1.795
-0.007
-0.4%
jan 1, 2013
1.85
+0.055
3.06%
jan 1, 2014
1.838
-0.012
-0.65%
jan 1, 2015
1.835
-0.004
-0.2%
Ranking of countries by current statistics by years


Comments: