29
/
en
AIzaSyAYiBZKx7MnpbEhh9jyipgxe19OcubqV5w
April 1, 2024
196617
Micronesia, Fed. Sts.
FSM
true
2
1
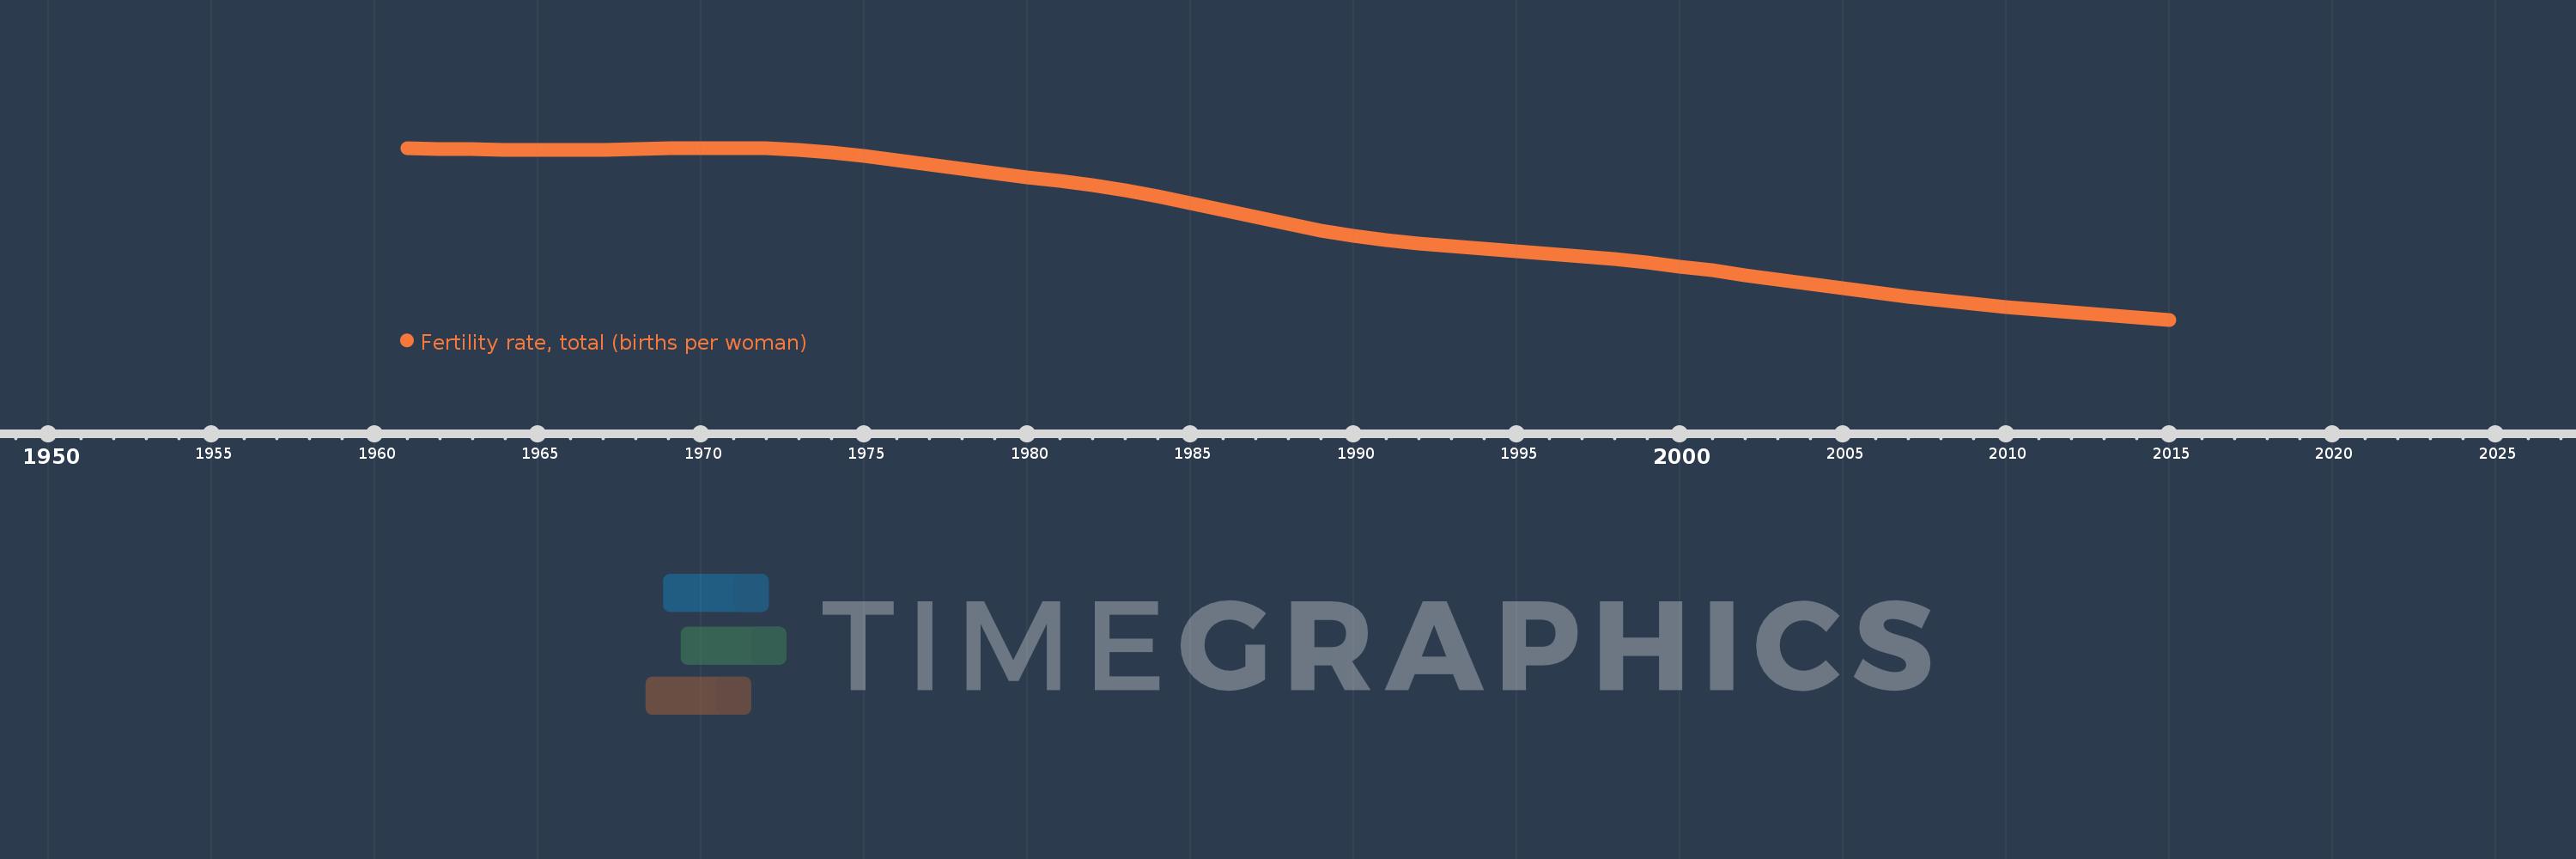
Fertility rate, total (births per woman)
2015,2014,2013,2012,2011,2010,2009,2008,2007,2006,2005,2004,2003,2002,2001,2000,1999,1998,1997,1996,1995,1994,1993,1992,1991,1990,1989,1988,1987,1986,1985,1984,1983,1982,1981,1980,1979,1978,1977,1976,1975,1974,1973,1972,1971,1970,1969,1968,1967,1966,1965,1964,1963,1962,1961
This statistics in other country:
AfghanistanAlbaniaAlgeriaAndorraAngolaAntigua and BarbudaArab WorldArgentinaArmeniaArubaAustraliaAustriaAzerbaijanBahamas, TheBahrainBangladeshBarbadosBelarusBelgiumBelizeBeninBermudaBhutanBoliviaBosnia and HerzegovinaBotswanaBrazilBrunei DarussalamBulgariaBurkina FasoBurundiCabo VerdeCambodiaCameroonCanadaCaribbean small statesCentral African RepublicCentral Europe and the BalticsChadChannel IslandsChileChinaColombiaComorosCongo, Dem. Rep.Congo, Rep.Costa RicaCote d'IvoireCroatiaCubaCuracaoCyprusCzech RepublicDenmarkDjiboutiDominicaDominican RepublicEarly-demographic dividendEast Asia & PacificEast Asia & Pacific (excluding high income)East Asia & Pacific (IDA & IBRD countries)EcuadorEgypt, Arab Rep.El SalvadorEquatorial GuineaEritreaEstoniaEthiopiaEuro areaEurope & Central AsiaEurope & Central Asia (excluding high income)Europe & Central Asia (IDA & IBRD countries)European UnionFaroe IslandsFijiFinlandFragile and conflict affected situationsFranceFrench PolynesiaGabonGambia, TheGeorgiaGermanyGhanaGreeceGreenlandGrenadaGuamGuatemalaGuineaGuinea-BissauGuyanaHaitiHeavily indebted poor countries (HIPC)High incomeHondurasHong Kong SAR, ChinaHungaryIBRD onlyIcelandIDA & IBRD totalIDA blendIDA onlyIDA totalIndiaIndonesiaIran, Islamic Rep.IraqIrelandIsle of ManIsraelItalyJamaicaJapanJordanKazakhstanKenyaKiribatiKorea, Dem. People’s Rep.Korea, Rep.KosovoKuwaitKyrgyz RepublicLao PDRLate-demographic dividendLatin America & Caribbean Latin America & Caribbean (excluding high income)Latin America & the Caribbean (IDA & IBRD countries)LatviaLeast developed countries: UN classificationLebanonLesothoLiberiaLibyaLiechtensteinLithuaniaLow & middle incomeLow incomeLower middle incomeLuxembourgMacao SAR, ChinaMacedonia, FYRMadagascarMalawiMalaysiaMaldivesMaliMaltaMarshall IslandsMauritaniaMauritiusMexicoMicronesia, Fed. Sts.Middle East & North AfricaMiddle East & North Africa (excluding high income)Middle East & North Africa (IDA & IBRD countries)Middle incomeMoldovaMongoliaMontenegroMoroccoMozambiqueMyanmarNamibiaNepalNetherlandsNew CaledoniaNew ZealandNicaraguaNigerNigeriaNorth AmericaNorwayOECD membersOmanOther small statesPacific island small statesPakistanPalauPanamaPapua New GuineaParaguayPeruPhilippinesPolandPortugalPost-demographic dividendPre-demographic dividendPuerto RicoQatarRomaniaRussian FederationRwandaSamoaSan MarinoSao Tome and PrincipeSaudi ArabiaSenegalSerbiaSeychellesSierra LeoneSingaporeSint Maarten (Dutch part)Slovak RepublicSloveniaSmall statesSolomon IslandsSomaliaSouth AfricaSouth AsiaSouth Asia (IDA & IBRD)South SudanSpainSri LankaSt. Kitts and NevisSt. LuciaSt. Martin (French part)St. Vincent and the GrenadinesSub-Saharan Africa Sub-Saharan Africa (excluding high income)Sub-Saharan Africa (IDA & IBRD countries)SudanSurinameSwazilandSwedenSwitzerlandSyrian Arab RepublicTajikistanTanzaniaThailandTimor-LesteTogoTongaTrinidad and TobagoTunisiaTurkeyTurkmenistanUgandaUkraineUnited Arab EmiratesUnited KingdomUnited StatesUpper middle incomeUruguayUzbekistanVanuatuVenezuela, RBVietnamVirgin Islands (U.S.)West Bank and GazaWorldYemen, Rep.ZambiaZimbabwe Timeline:
This timeline shows a graph from 1961 to 2015 of Micronesia, Fed. Sts.. No data until 1960. Number of actual observations by date: 55.
Source name:
World Development Indicators
Source organization:
(1) United Nations Population Division. World Population Prospects, (2) Census reports and other statistical publications from national statistical offices, (3) Eurostat: Demographic Statistics, (4) United Nations Statistical Division. Population and Vital Statistics Reprot (various years), (5) U.S. Census Bureau: International Database, and (6) Secretariat of the Pacific Community: Statistics and Demography Programme.
Categories, topics:
Health, Gender
Last updated:
apr 23, 2017
Indicators value changes by year
At the date of observation
Value
Absolute change
Change from previous value
jan 1, 1961
6.934
+6.934
0.0%
jan 1, 1962
6.917
-0.017
-0.25%
jan 1, 1963
6.905
-0.012
-0.17%
jan 1, 1964
6.897
-0.008
-0.12%
jan 1, 1965
6.893
-0.004
-0.06%
jan 1, 1966
6.894
+0.001
0.01%
jan 1, 1967
6.9
+0.006
0.09%
jan 1, 1968
6.911
+0.011
0.16%
jan 1, 1969
6.924
+0.013
0.19%
jan 1, 1970
6.935
+0.011
0.16%
jan 1, 1971
6.938
+0.003
0.04%
jan 1, 1972
6.925
-0.013
-0.19%
jan 1, 1973
6.894
-0.031
-0.45%
jan 1, 1974
6.842
-0.052
-0.75%
jan 1, 1975
6.77
-0.072
-1.05%
jan 1, 1976
6.682
-0.088
-1.3%
jan 1, 1977
6.586
-0.096
-1.44%
jan 1, 1978
6.49
-0.096
-1.46%
jan 1, 1979
6.398
-0.092
-1.42%
jan 1, 1980
6.311
-0.087
-1.36%
jan 1, 1981
6.223
-0.088
-1.39%
jan 1, 1982
6.129
-0.094
-1.51%
jan 1, 1983
6.02
-0.109
-1.78%
jan 1, 1984
5.894
-0.126
-2.09%
jan 1, 1985
5.752
-0.142
-2.41%
jan 1, 1986
5.6
-0.152
-2.64%
jan 1, 1987
5.446
-0.154
-2.75%
jan 1, 1988
5.299
-0.147
-2.7%
jan 1, 1989
5.167
-0.132
-2.49%
jan 1, 1990
5.052
-0.115
-2.23%
jan 1, 1991
4.958
-0.094
-1.86%
jan 1, 1992
4.882
-0.076
-1.53%
jan 1, 1993
4.82
-0.062
-1.27%
jan 1, 1994
4.766
-0.054
-1.12%
jan 1, 1995
4.716
-0.05
-1.05%
jan 1, 1996
4.664
-0.052
-1.1%
jan 1, 1997
4.608
-0.056
-1.2%
jan 1, 1998
4.544
-0.064
-1.39%
jan 1, 1999
4.471
-0.073
-1.61%
jan 1, 2000
4.39
-0.081
-1.81%
jan 1, 2001
4.3
-0.09
-2.05%
jan 1, 2002
4.204
-0.096
-2.23%
jan 1, 2003
4.105
-0.099
-2.35%
jan 1, 2004
4.007
-0.098
-2.39%
jan 1, 2005
3.912
-0.095
-2.37%
jan 1, 2006
3.823
-0.089
-2.28%
jan 1, 2007
3.739
-0.084
-2.2%
jan 1, 2008
3.661
-0.078
-2.09%
jan 1, 2009
3.589
-0.072
-1.97%
jan 1, 2010
3.522
-0.067
-1.87%
jan 1, 2011
3.46
-0.062
-1.76%
jan 1, 2012
3.402
-0.058
-1.68%
jan 1, 2013
3.347
-0.055
-1.62%
jan 1, 2014
3.294
-0.053
-1.58%
jan 1, 2015
3.243
-0.051
-1.55%
Ranking of countries by current statistics by years


Comments: