29
/
en
AIzaSyAYiBZKx7MnpbEhh9jyipgxe19OcubqV5w
April 1, 2024
29820
Euro area
EMU
false
2
1
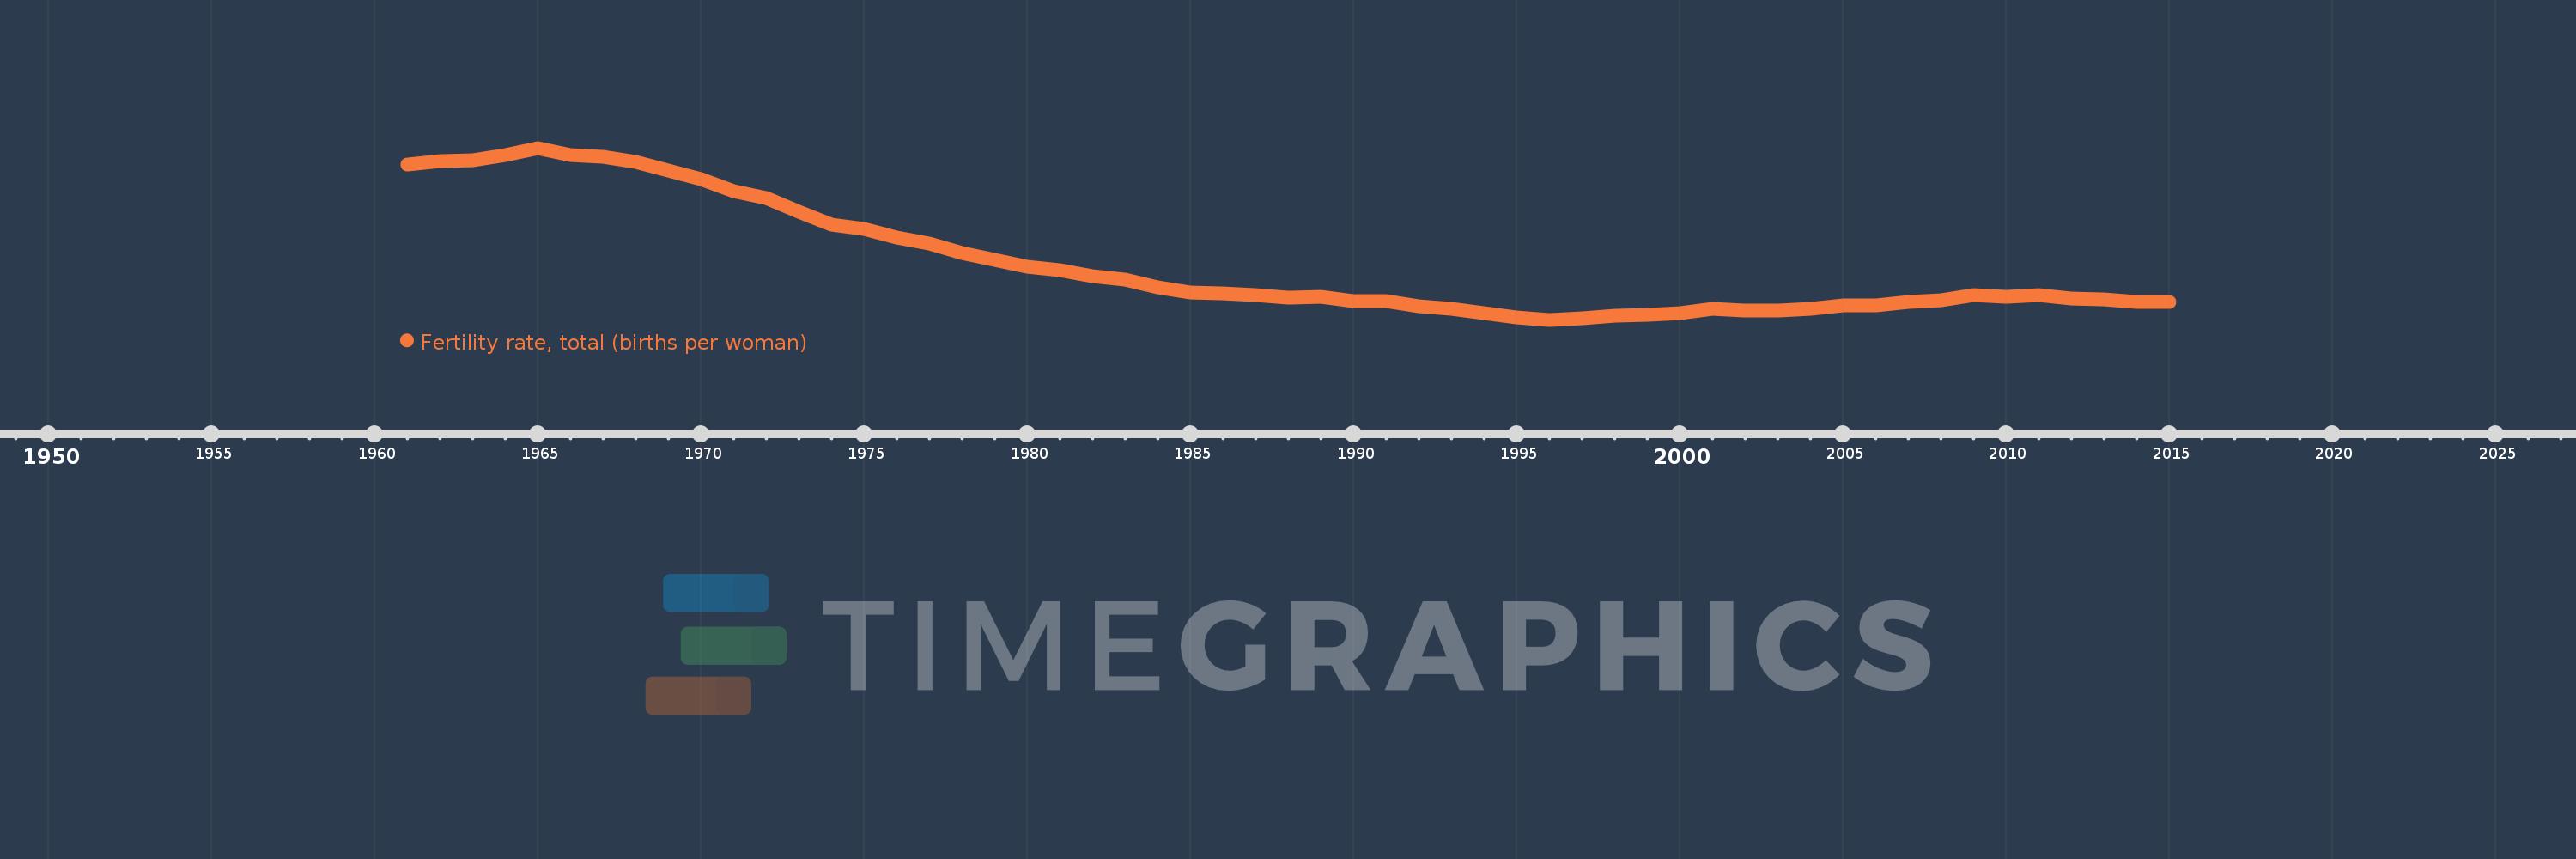
Fertility rate, total (births per woman)
2015,2014,2013,2012,2011,2010,2009,2008,2007,2006,2005,2004,2003,2002,2001,2000,1999,1998,1997,1996,1995,1994,1993,1992,1991,1990,1989,1988,1987,1986,1985,1984,1983,1982,1981,1980,1979,1978,1977,1976,1975,1974,1973,1972,1971,1970,1969,1968,1967,1966,1965,1964,1963,1962,1961
This statistics in other country:
AfghanistanAlbaniaAlgeriaAndorraAngolaAntigua and BarbudaArab WorldArgentinaArmeniaArubaAustraliaAustriaAzerbaijanBahamas, TheBahrainBangladeshBarbadosBelarusBelgiumBelizeBeninBermudaBhutanBoliviaBosnia and HerzegovinaBotswanaBrazilBrunei DarussalamBulgariaBurkina FasoBurundiCabo VerdeCambodiaCameroonCanadaCaribbean small statesCentral African RepublicCentral Europe and the BalticsChadChannel IslandsChileChinaColombiaComorosCongo, Dem. Rep.Congo, Rep.Costa RicaCote d'IvoireCroatiaCubaCuracaoCyprusCzech RepublicDenmarkDjiboutiDominicaDominican RepublicEarly-demographic dividendEast Asia & PacificEast Asia & Pacific (excluding high income)East Asia & Pacific (IDA & IBRD countries)EcuadorEgypt, Arab Rep.El SalvadorEquatorial GuineaEritreaEstoniaEthiopiaEuro areaEurope & Central AsiaEurope & Central Asia (excluding high income)Europe & Central Asia (IDA & IBRD countries)European UnionFaroe IslandsFijiFinlandFragile and conflict affected situationsFranceFrench PolynesiaGabonGambia, TheGeorgiaGermanyGhanaGreeceGreenlandGrenadaGuamGuatemalaGuineaGuinea-BissauGuyanaHaitiHeavily indebted poor countries (HIPC)High incomeHondurasHong Kong SAR, ChinaHungaryIBRD onlyIcelandIDA & IBRD totalIDA blendIDA onlyIDA totalIndiaIndonesiaIran, Islamic Rep.IraqIrelandIsle of ManIsraelItalyJamaicaJapanJordanKazakhstanKenyaKiribatiKorea, Dem. People’s Rep.Korea, Rep.KosovoKuwaitKyrgyz RepublicLao PDRLate-demographic dividendLatin America & Caribbean Latin America & Caribbean (excluding high income)Latin America & the Caribbean (IDA & IBRD countries)LatviaLeast developed countries: UN classificationLebanonLesothoLiberiaLibyaLiechtensteinLithuaniaLow & middle incomeLow incomeLower middle incomeLuxembourgMacao SAR, ChinaMacedonia, FYRMadagascarMalawiMalaysiaMaldivesMaliMaltaMarshall IslandsMauritaniaMauritiusMexicoMicronesia, Fed. Sts.Middle East & North AfricaMiddle East & North Africa (excluding high income)Middle East & North Africa (IDA & IBRD countries)Middle incomeMoldovaMongoliaMontenegroMoroccoMozambiqueMyanmarNamibiaNepalNetherlandsNew CaledoniaNew ZealandNicaraguaNigerNigeriaNorth AmericaNorwayOECD membersOmanOther small statesPacific island small statesPakistanPalauPanamaPapua New GuineaParaguayPeruPhilippinesPolandPortugalPost-demographic dividendPre-demographic dividendPuerto RicoQatarRomaniaRussian FederationRwandaSamoaSan MarinoSao Tome and PrincipeSaudi ArabiaSenegalSerbiaSeychellesSierra LeoneSingaporeSint Maarten (Dutch part)Slovak RepublicSloveniaSmall statesSolomon IslandsSomaliaSouth AfricaSouth AsiaSouth Asia (IDA & IBRD)South SudanSpainSri LankaSt. Kitts and NevisSt. LuciaSt. Martin (French part)St. Vincent and the GrenadinesSub-Saharan Africa Sub-Saharan Africa (excluding high income)Sub-Saharan Africa (IDA & IBRD countries)SudanSurinameSwazilandSwedenSwitzerlandSyrian Arab RepublicTajikistanTanzaniaThailandTimor-LesteTogoTongaTrinidad and TobagoTunisiaTurkeyTurkmenistanUgandaUkraineUnited Arab EmiratesUnited KingdomUnited StatesUpper middle incomeUruguayUzbekistanVanuatuVenezuela, RBVietnamVirgin Islands (U.S.)West Bank and GazaWorldYemen, Rep.ZambiaZimbabwe Timeline:
This timeline shows a graph from 1961 to 2015 of Euro area. No data until 1960. Number of actual observations by date: 55.
Source name:
World Development Indicators
Source organization:
(1) United Nations Population Division. World Population Prospects, (2) Census reports and other statistical publications from national statistical offices, (3) Eurostat: Demographic Statistics, (4) United Nations Statistical Division. Population and Vital Statistics Reprot (various years), (5) U.S. Census Bureau: International Database, and (6) Secretariat of the Pacific Community: Statistics and Demography Programme.
Categories, topics:
Health, Gender
Last updated:
apr 23, 2017
Indicators value changes by year
At the date of observation
Value
Absolute change
Change from previous value
jan 1, 1961
2.601
+2.601
0.0%
jan 1, 1962
2.633
+0.032
1.22%
jan 1, 1963
2.639
+0.006
0.21%
jan 1, 1964
2.68
+0.041
1.56%
jan 1, 1965
2.733
+0.053
2.0%
jan 1, 1966
2.679
-0.054
-1.98%
jan 1, 1967
2.661
-0.018
-0.68%
jan 1, 1968
2.62
-0.041
-1.55%
jan 1, 1969
2.557
-0.063
-2.39%
jan 1, 1970
2.487
-0.07
-2.74%
jan 1, 1971
2.393
-0.094
-3.78%
jan 1, 1972
2.342
-0.051
-2.14%
jan 1, 1973
2.234
-0.108
-4.6%
jan 1, 1974
2.131
-0.103
-4.61%
jan 1, 1975
2.1
-0.031
-1.45%
jan 1, 1976
2.027
-0.074
-3.51%
jan 1, 1977
1.985
-0.042
-2.06%
jan 1, 1978
1.909
-0.075
-3.79%
jan 1, 1979
1.853
-0.056
-2.95%
jan 1, 1980
1.8
-0.053
-2.86%
jan 1, 1981
1.772
-0.028
-1.56%
jan 1, 1982
1.726
-0.046
-2.59%
jan 1, 1983
1.698
-0.028
-1.64%
jan 1, 1984
1.639
-0.059
-3.48%
jan 1, 1985
1.601
-0.038
-2.29%
jan 1, 1986
1.59
-0.011
-0.69%
jan 1, 1987
1.579
-0.011
-0.7%
jan 1, 1988
1.559
-0.02
-1.28%
jan 1, 1989
1.562
+0.003
0.21%
jan 1, 1990
1.53
-0.033
-2.09%
jan 1, 1991
1.534
+0.005
0.32%
jan 1, 1992
1.489
-0.046
-2.97%
jan 1, 1993
1.47
-0.019
-1.28%
jan 1, 1994
1.437
-0.033
-2.23%
jan 1, 1995
1.4
-0.037
-2.59%
jan 1, 1996
1.385
-0.014
-1.02%
jan 1, 1997
1.399
+0.014
1.0%
jan 1, 1998
1.419
+0.02
1.44%
jan 1, 1999
1.421
+0.001
0.09%
jan 1, 2000
1.434
+0.014
0.96%
jan 1, 2001
1.473
+0.038
2.67%
jan 1, 2002
1.458
-0.015
-1.02%
jan 1, 2003
1.459
+0.001
0.07%
jan 1, 2004
1.473
+0.014
0.99%
jan 1, 2005
1.496
+0.023
1.53%
jan 1, 2006
1.499
+0.004
0.25%
jan 1, 2007
1.523
+0.023
1.55%
jan 1, 2008
1.54
+0.017
1.1%
jan 1, 2009
1.58
+0.04
2.63%
jan 1, 2010
1.564
-0.016
-1.01%
jan 1, 2011
1.58
+0.016
1.03%
jan 1, 2012
1.554
-0.026
-1.63%
jan 1, 2013
1.548
-0.006
-0.4%
jan 1, 2014
1.524
-0.024
-1.57%
jan 1, 2015
1.525
+0.002
0.11%
Ranking of countries by current statistics by years


Comments: