29
/
en
AIzaSyAYiBZKx7MnpbEhh9jyipgxe19OcubqV5w
April 1, 2024
105935
China
CHN
true
2
1
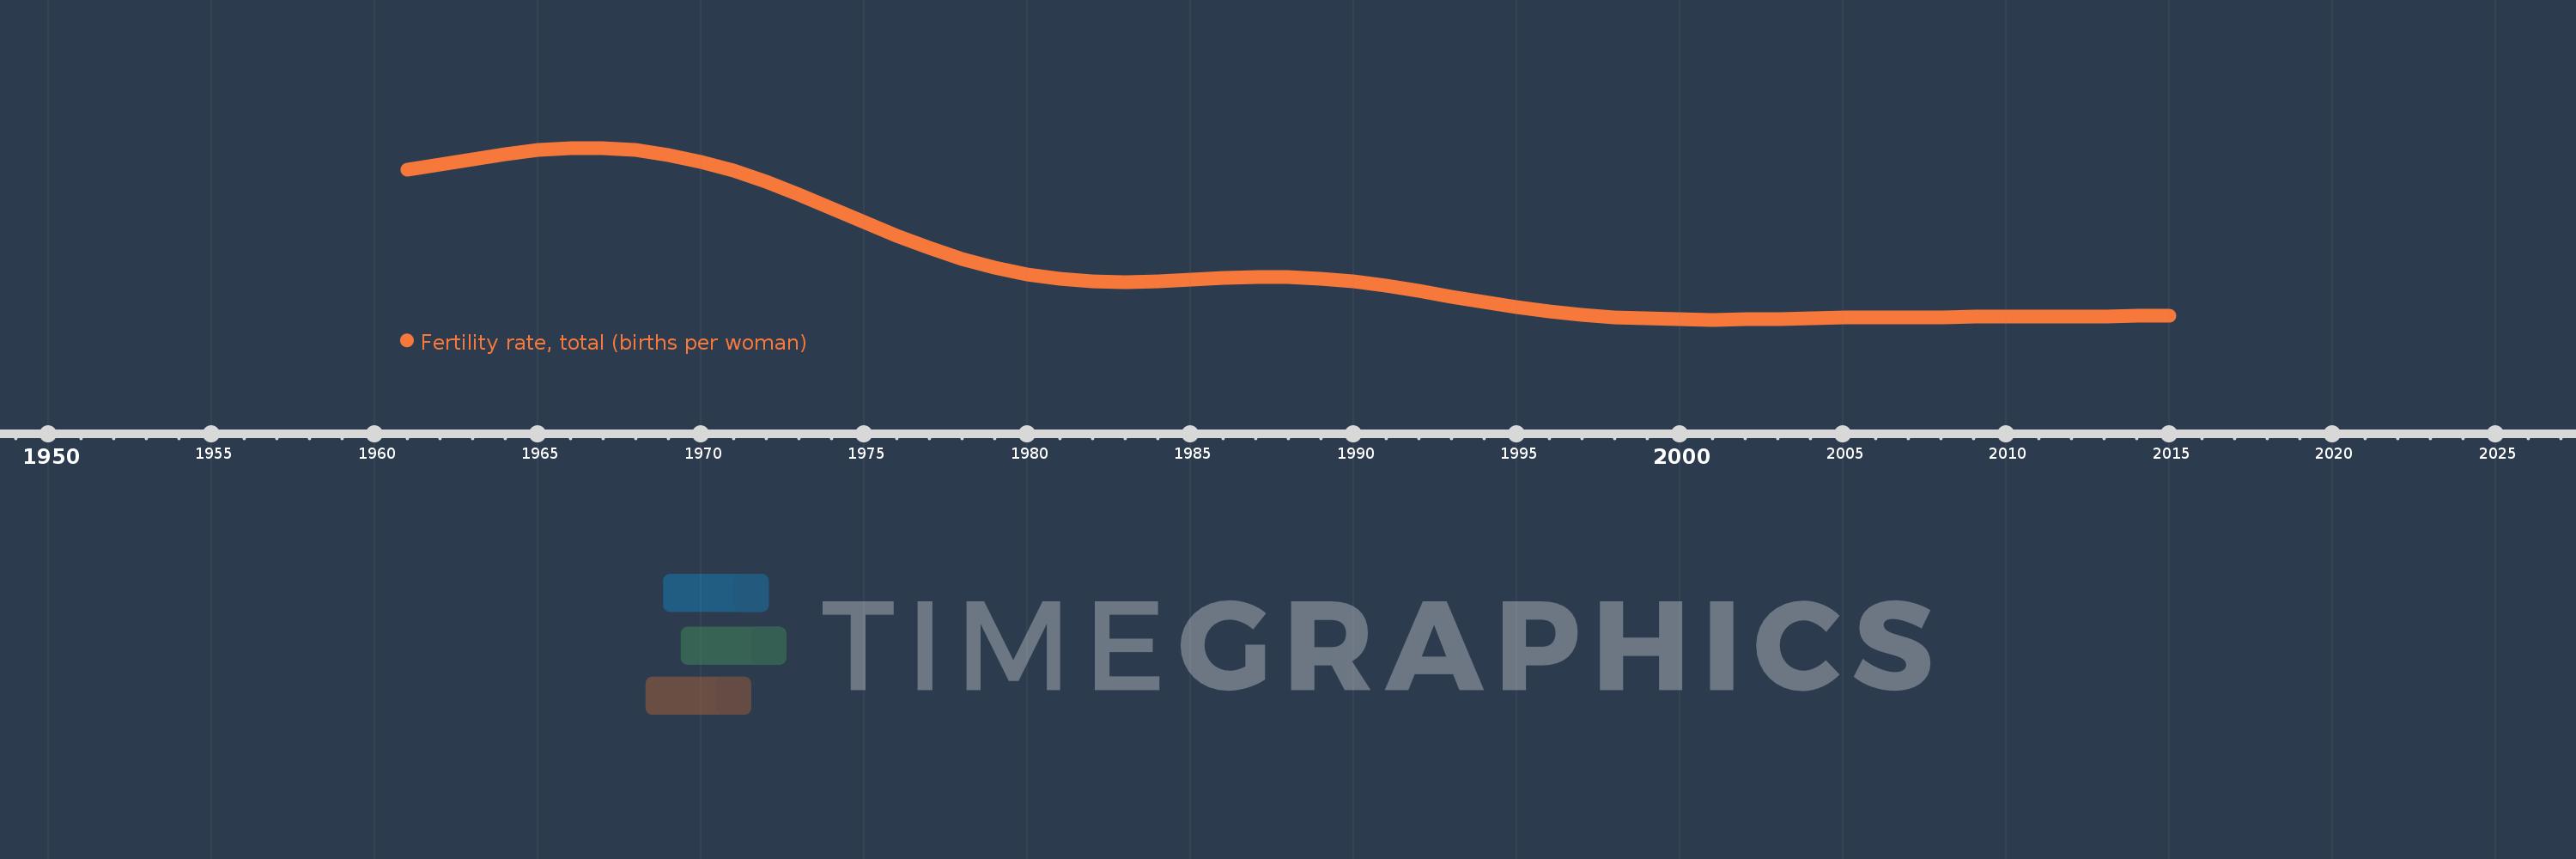
Fertility rate, total (births per woman)
2015,2014,2013,2012,2011,2010,2009,2008,2007,2006,2005,2004,2003,2002,2001,2000,1999,1998,1997,1996,1995,1994,1993,1992,1991,1990,1989,1988,1987,1986,1985,1984,1983,1982,1981,1980,1979,1978,1977,1976,1975,1974,1973,1972,1971,1970,1969,1968,1967,1966,1965,1964,1963,1962,1961
This statistics in other country:
AfghanistanAlbaniaAlgeriaAndorraAngolaAntigua and BarbudaArab WorldArgentinaArmeniaArubaAustraliaAustriaAzerbaijanBahamas, TheBahrainBangladeshBarbadosBelarusBelgiumBelizeBeninBermudaBhutanBoliviaBosnia and HerzegovinaBotswanaBrazilBrunei DarussalamBulgariaBurkina FasoBurundiCabo VerdeCambodiaCameroonCanadaCaribbean small statesCentral African RepublicCentral Europe and the BalticsChadChannel IslandsChileChinaColombiaComorosCongo, Dem. Rep.Congo, Rep.Costa RicaCote d'IvoireCroatiaCubaCuracaoCyprusCzech RepublicDenmarkDjiboutiDominicaDominican RepublicEarly-demographic dividendEast Asia & PacificEast Asia & Pacific (excluding high income)East Asia & Pacific (IDA & IBRD countries)EcuadorEgypt, Arab Rep.El SalvadorEquatorial GuineaEritreaEstoniaEthiopiaEuro areaEurope & Central AsiaEurope & Central Asia (excluding high income)Europe & Central Asia (IDA & IBRD countries)European UnionFaroe IslandsFijiFinlandFragile and conflict affected situationsFranceFrench PolynesiaGabonGambia, TheGeorgiaGermanyGhanaGreeceGreenlandGrenadaGuamGuatemalaGuineaGuinea-BissauGuyanaHaitiHeavily indebted poor countries (HIPC)High incomeHondurasHong Kong SAR, ChinaHungaryIBRD onlyIcelandIDA & IBRD totalIDA blendIDA onlyIDA totalIndiaIndonesiaIran, Islamic Rep.IraqIrelandIsle of ManIsraelItalyJamaicaJapanJordanKazakhstanKenyaKiribatiKorea, Dem. People’s Rep.Korea, Rep.KosovoKuwaitKyrgyz RepublicLao PDRLate-demographic dividendLatin America & Caribbean Latin America & Caribbean (excluding high income)Latin America & the Caribbean (IDA & IBRD countries)LatviaLeast developed countries: UN classificationLebanonLesothoLiberiaLibyaLiechtensteinLithuaniaLow & middle incomeLow incomeLower middle incomeLuxembourgMacao SAR, ChinaMacedonia, FYRMadagascarMalawiMalaysiaMaldivesMaliMaltaMarshall IslandsMauritaniaMauritiusMexicoMicronesia, Fed. Sts.Middle East & North AfricaMiddle East & North Africa (excluding high income)Middle East & North Africa (IDA & IBRD countries)Middle incomeMoldovaMongoliaMontenegroMoroccoMozambiqueMyanmarNamibiaNepalNetherlandsNew CaledoniaNew ZealandNicaraguaNigerNigeriaNorth AmericaNorwayOECD membersOmanOther small statesPacific island small statesPakistanPalauPanamaPapua New GuineaParaguayPeruPhilippinesPolandPortugalPost-demographic dividendPre-demographic dividendPuerto RicoQatarRomaniaRussian FederationRwandaSamoaSan MarinoSao Tome and PrincipeSaudi ArabiaSenegalSerbiaSeychellesSierra LeoneSingaporeSint Maarten (Dutch part)Slovak RepublicSloveniaSmall statesSolomon IslandsSomaliaSouth AfricaSouth AsiaSouth Asia (IDA & IBRD)South SudanSpainSri LankaSt. Kitts and NevisSt. LuciaSt. Martin (French part)St. Vincent and the GrenadinesSub-Saharan Africa Sub-Saharan Africa (excluding high income)Sub-Saharan Africa (IDA & IBRD countries)SudanSurinameSwazilandSwedenSwitzerlandSyrian Arab RepublicTajikistanTanzaniaThailandTimor-LesteTogoTongaTrinidad and TobagoTunisiaTurkeyTurkmenistanUgandaUkraineUnited Arab EmiratesUnited KingdomUnited StatesUpper middle incomeUruguayUzbekistanVanuatuVenezuela, RBVietnamVirgin Islands (U.S.)West Bank and GazaWorldYemen, Rep.ZambiaZimbabwe Timeline:
This timeline shows a graph from 1961 to 2015 of China. No data until 1960. Number of actual observations by date: 55.
Source name:
World Development Indicators
Source organization:
(1) United Nations Population Division. World Population Prospects, (2) Census reports and other statistical publications from national statistical offices, (3) Eurostat: Demographic Statistics, (4) United Nations Statistical Division. Population and Vital Statistics Reprot (various years), (5) U.S. Census Bureau: International Database, and (6) Secretariat of the Pacific Community: Statistics and Demography Programme.
Categories, topics:
Health, Gender
Last updated:
apr 23, 2017
Indicators value changes by year
At the date of observation
Value
Absolute change
Change from previous value
jan 1, 1961
5.754
+5.754
0.0%
jan 1, 1962
5.904
+0.15
2.61%
jan 1, 1963
6.061
+0.157
2.66%
jan 1, 1964
6.206
+0.145
2.39%
jan 1, 1965
6.32
+0.114
1.84%
jan 1, 1966
6.385
+0.065
1.03%
jan 1, 1967
6.384
-0.001
-0.02%
jan 1, 1968
6.317
-0.067
-1.05%
jan 1, 1969
6.184
-0.133
-2.11%
jan 1, 1970
5.986
-0.198
-3.2%
jan 1, 1971
5.725
-0.261
-4.36%
jan 1, 1972
5.403
-0.322
-5.62%
jan 1, 1973
5.036
-0.367
-6.79%
jan 1, 1974
4.644
-0.392
-7.78%
jan 1, 1975
4.245
-0.399
-8.59%
jan 1, 1976
3.861
-0.384
-9.05%
jan 1, 1977
3.51
-0.351
-9.09%
jan 1, 1978
3.202
-0.308
-8.77%
jan 1, 1979
2.945
-0.257
-8.03%
jan 1, 1980
2.747
-0.198
-6.72%
jan 1, 1981
2.613
-0.134
-4.88%
jan 1, 1982
2.546
-0.067
-2.56%
jan 1, 1983
2.533
-0.013
-0.51%
jan 1, 1984
2.556
+0.023
0.91%
jan 1, 1985
2.602
+0.046
1.8%
jan 1, 1986
2.65
+0.048
1.84%
jan 1, 1987
2.678
+0.028
1.06%
jan 1, 1988
2.676
-0.002
-0.07%
jan 1, 1989
2.634
-0.042
-1.57%
jan 1, 1990
2.551
-0.083
-3.15%
jan 1, 1991
2.428
-0.123
-4.82%
jan 1, 1992
2.276
-0.152
-6.26%
jan 1, 1993
2.111
-0.165
-7.25%
jan 1, 1994
1.952
-0.159
-7.53%
jan 1, 1995
1.806
-0.146
-7.48%
jan 1, 1996
1.684
-0.122
-6.76%
jan 1, 1997
1.59
-0.094
-5.58%
jan 1, 1998
1.522
-0.068
-4.28%
jan 1, 1999
1.477
-0.045
-2.96%
jan 1, 2000
1.453
-0.024
-1.62%
jan 1, 2001
1.447
-0.006
-0.41%
jan 1, 2002
1.455
+0.008
0.55%
jan 1, 2003
1.469
+0.014
0.96%
jan 1, 2004
1.486
+0.017
1.16%
jan 1, 2005
1.502
+0.016
1.08%
jan 1, 2006
1.513
+0.011
0.73%
jan 1, 2007
1.521
+0.008
0.53%
jan 1, 2008
1.526
+0.005
0.33%
jan 1, 2009
1.531
+0.005
0.33%
jan 1, 2010
1.535
+0.004
0.26%
jan 1, 2011
1.539
+0.004
0.26%
jan 1, 2012
1.544
+0.005
0.32%
jan 1, 2013
1.549
+0.005
0.32%
jan 1, 2014
1.555
+0.006
0.39%
jan 1, 2015
1.562
+0.007
0.45%
Ranking of countries by current statistics by years


Comments: