29
/
en
AIzaSyAYiBZKx7MnpbEhh9jyipgxe19OcubqV5w
April 1, 2024
104821
Chile
CHL
true
2
1
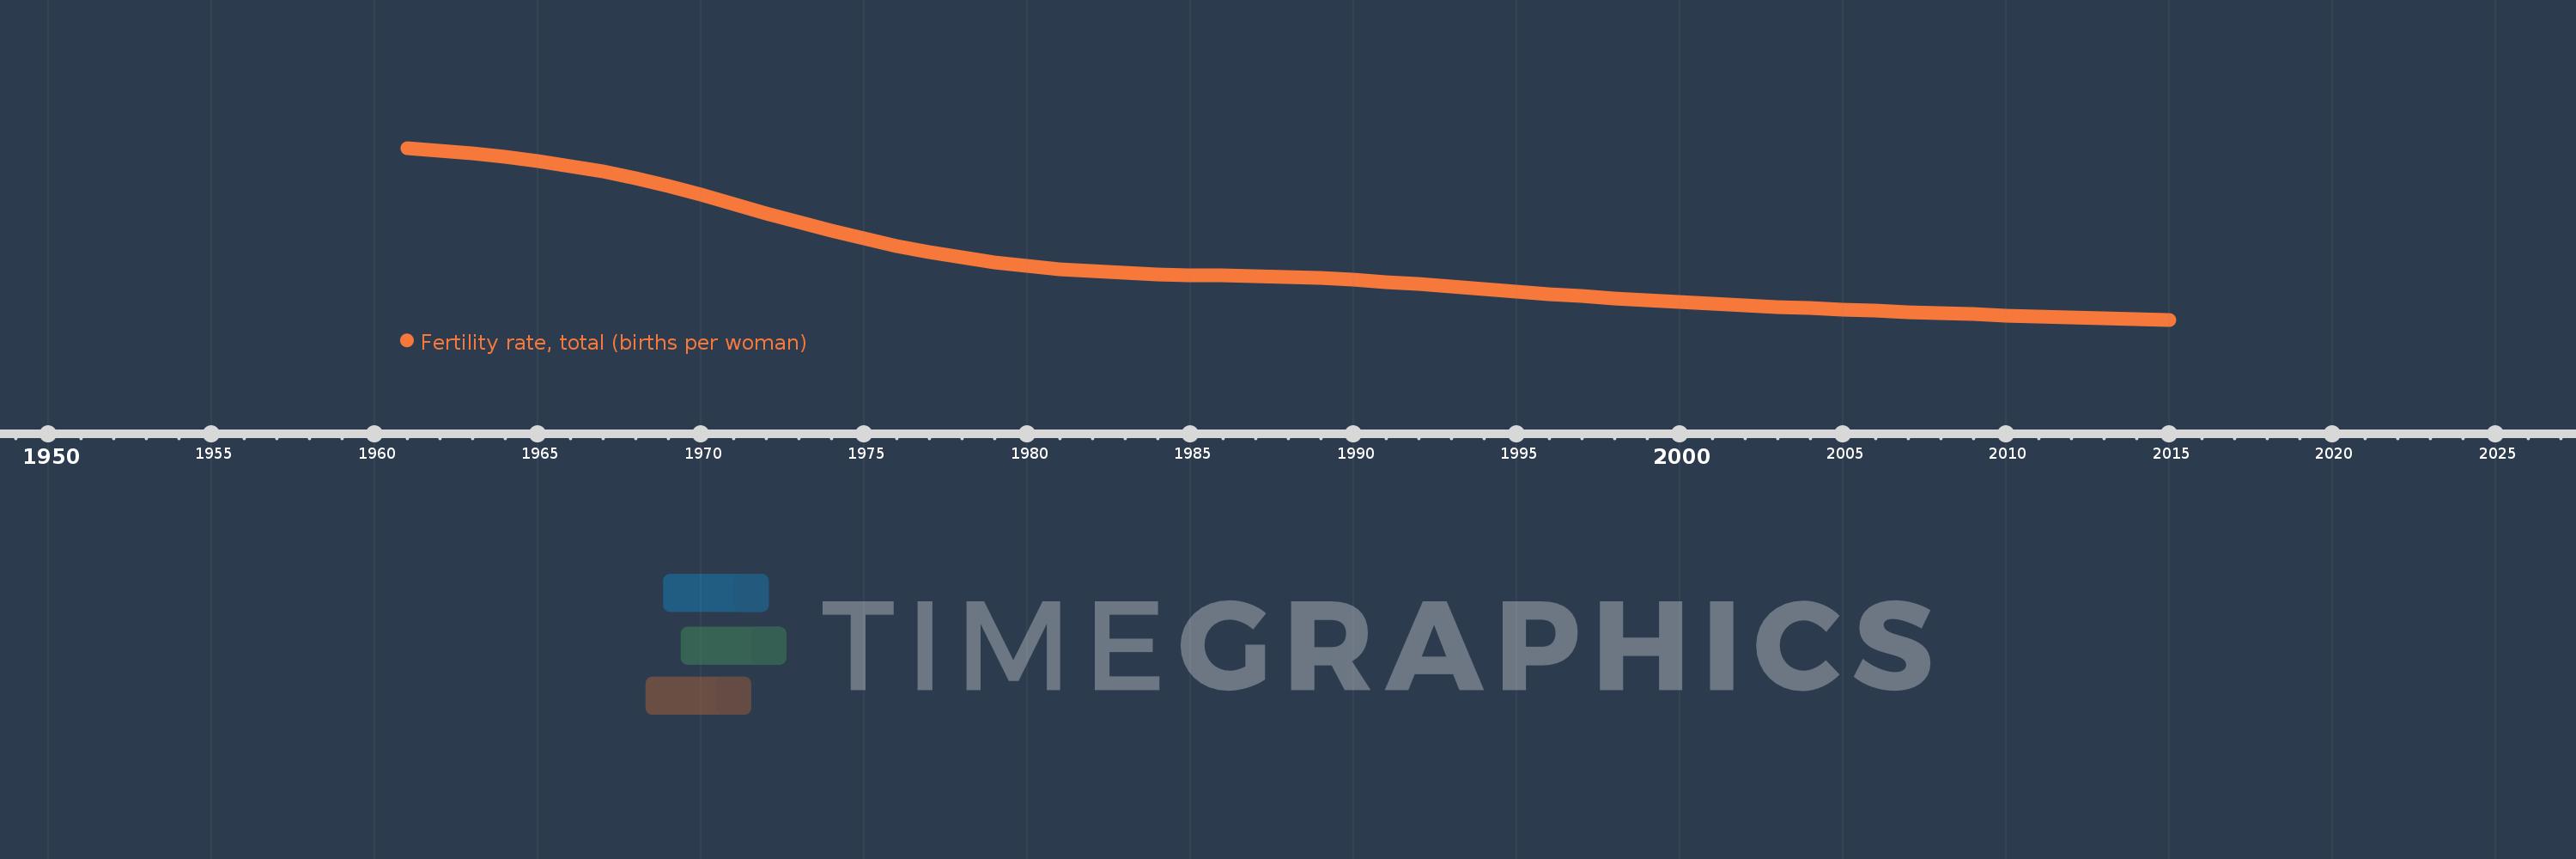
Fertility rate, total (births per woman)
2015,2014,2013,2012,2011,2010,2009,2008,2007,2006,2005,2004,2003,2002,2001,2000,1999,1998,1997,1996,1995,1994,1993,1992,1991,1990,1989,1988,1987,1986,1985,1984,1983,1982,1981,1980,1979,1978,1977,1976,1975,1974,1973,1972,1971,1970,1969,1968,1967,1966,1965,1964,1963,1962,1961
This statistics in other country:
AfghanistanAlbaniaAlgeriaAndorraAngolaAntigua and BarbudaArab WorldArgentinaArmeniaArubaAustraliaAustriaAzerbaijanBahamas, TheBahrainBangladeshBarbadosBelarusBelgiumBelizeBeninBermudaBhutanBoliviaBosnia and HerzegovinaBotswanaBrazilBrunei DarussalamBulgariaBurkina FasoBurundiCabo VerdeCambodiaCameroonCanadaCaribbean small statesCentral African RepublicCentral Europe and the BalticsChadChannel IslandsChileChinaColombiaComorosCongo, Dem. Rep.Congo, Rep.Costa RicaCote d'IvoireCroatiaCubaCuracaoCyprusCzech RepublicDenmarkDjiboutiDominicaDominican RepublicEarly-demographic dividendEast Asia & PacificEast Asia & Pacific (excluding high income)East Asia & Pacific (IDA & IBRD countries)EcuadorEgypt, Arab Rep.El SalvadorEquatorial GuineaEritreaEstoniaEthiopiaEuro areaEurope & Central AsiaEurope & Central Asia (excluding high income)Europe & Central Asia (IDA & IBRD countries)European UnionFaroe IslandsFijiFinlandFragile and conflict affected situationsFranceFrench PolynesiaGabonGambia, TheGeorgiaGermanyGhanaGreeceGreenlandGrenadaGuamGuatemalaGuineaGuinea-BissauGuyanaHaitiHeavily indebted poor countries (HIPC)High incomeHondurasHong Kong SAR, ChinaHungaryIBRD onlyIcelandIDA & IBRD totalIDA blendIDA onlyIDA totalIndiaIndonesiaIran, Islamic Rep.IraqIrelandIsle of ManIsraelItalyJamaicaJapanJordanKazakhstanKenyaKiribatiKorea, Dem. People’s Rep.Korea, Rep.KosovoKuwaitKyrgyz RepublicLao PDRLate-demographic dividendLatin America & Caribbean Latin America & Caribbean (excluding high income)Latin America & the Caribbean (IDA & IBRD countries)LatviaLeast developed countries: UN classificationLebanonLesothoLiberiaLibyaLiechtensteinLithuaniaLow & middle incomeLow incomeLower middle incomeLuxembourgMacao SAR, ChinaMacedonia, FYRMadagascarMalawiMalaysiaMaldivesMaliMaltaMarshall IslandsMauritaniaMauritiusMexicoMicronesia, Fed. Sts.Middle East & North AfricaMiddle East & North Africa (excluding high income)Middle East & North Africa (IDA & IBRD countries)Middle incomeMoldovaMongoliaMontenegroMoroccoMozambiqueMyanmarNamibiaNepalNetherlandsNew CaledoniaNew ZealandNicaraguaNigerNigeriaNorth AmericaNorwayOECD membersOmanOther small statesPacific island small statesPakistanPalauPanamaPapua New GuineaParaguayPeruPhilippinesPolandPortugalPost-demographic dividendPre-demographic dividendPuerto RicoQatarRomaniaRussian FederationRwandaSamoaSan MarinoSao Tome and PrincipeSaudi ArabiaSenegalSerbiaSeychellesSierra LeoneSingaporeSint Maarten (Dutch part)Slovak RepublicSloveniaSmall statesSolomon IslandsSomaliaSouth AfricaSouth AsiaSouth Asia (IDA & IBRD)South SudanSpainSri LankaSt. Kitts and NevisSt. LuciaSt. Martin (French part)St. Vincent and the GrenadinesSub-Saharan Africa Sub-Saharan Africa (excluding high income)Sub-Saharan Africa (IDA & IBRD countries)SudanSurinameSwazilandSwedenSwitzerlandSyrian Arab RepublicTajikistanTanzaniaThailandTimor-LesteTogoTongaTrinidad and TobagoTunisiaTurkeyTurkmenistanUgandaUkraineUnited Arab EmiratesUnited KingdomUnited StatesUpper middle incomeUruguayUzbekistanVanuatuVenezuela, RBVietnamVirgin Islands (U.S.)West Bank and GazaWorldYemen, Rep.ZambiaZimbabwe Timeline:
This timeline shows a graph from 1961 to 2015 of Chile. No data until 1960. Number of actual observations by date: 55.
Source name:
World Development Indicators
Source organization:
(1) United Nations Population Division. World Population Prospects, (2) Census reports and other statistical publications from national statistical offices, (3) Eurostat: Demographic Statistics, (4) United Nations Statistical Division. Population and Vital Statistics Reprot (various years), (5) U.S. Census Bureau: International Database, and (6) Secretariat of the Pacific Community: Statistics and Demography Programme.
Categories, topics:
Health, Gender
Last updated:
apr 23, 2017
Indicators value changes by year
At the date of observation
Value
Absolute change
Change from previous value
jan 1, 1961
5.113
+5.113
0.0%
jan 1, 1962
5.066
-0.047
-0.92%
jan 1, 1963
5.009
-0.057
-1.13%
jan 1, 1964
4.94
-0.069
-1.38%
jan 1, 1965
4.859
-0.081
-1.64%
jan 1, 1966
4.763
-0.096
-1.98%
jan 1, 1967
4.648
-0.115
-2.41%
jan 1, 1968
4.514
-0.134
-2.88%
jan 1, 1969
4.363
-0.151
-3.35%
jan 1, 1970
4.197
-0.166
-3.8%
jan 1, 1971
4.021
-0.176
-4.19%
jan 1, 1972
3.842
-0.179
-4.45%
jan 1, 1973
3.665
-0.177
-4.61%
jan 1, 1974
3.496
-0.169
-4.61%
jan 1, 1975
3.341
-0.155
-4.43%
jan 1, 1976
3.201
-0.14
-4.19%
jan 1, 1977
3.08
-0.121
-3.78%
jan 1, 1978
2.976
-0.104
-3.38%
jan 1, 1979
2.886
-0.09
-3.02%
jan 1, 1980
2.81
-0.076
-2.63%
jan 1, 1981
2.749
-0.061
-2.17%
jan 1, 1982
2.703
-0.046
-1.67%
jan 1, 1983
2.67
-0.033
-1.22%
jan 1, 1984
2.649
-0.021
-0.79%
jan 1, 1985
2.634
-0.015
-0.57%
jan 1, 1986
2.622
-0.012
-0.46%
jan 1, 1987
2.61
-0.012
-0.46%
jan 1, 1988
2.593
-0.017
-0.65%
jan 1, 1989
2.57
-0.023
-0.89%
jan 1, 1990
2.539
-0.031
-1.21%
jan 1, 1991
2.501
-0.038
-1.5%
jan 1, 1992
2.456
-0.045
-1.8%
jan 1, 1993
2.407
-0.049
-2.0%
jan 1, 1994
2.358
-0.049
-2.04%
jan 1, 1995
2.311
-0.047
-1.99%
jan 1, 1996
2.265
-0.046
-1.99%
jan 1, 1997
2.222
-0.043
-1.9%
jan 1, 1998
2.181
-0.041
-1.85%
jan 1, 1999
2.143
-0.038
-1.74%
jan 1, 2000
2.107
-0.036
-1.68%
jan 1, 2001
2.073
-0.034
-1.61%
jan 1, 2002
2.042
-0.031
-1.5%
jan 1, 2003
2.013
-0.029
-1.42%
jan 1, 2004
1.986
-0.027
-1.34%
jan 1, 2005
1.959
-0.027
-1.36%
jan 1, 2006
1.934
-0.025
-1.28%
jan 1, 2007
1.91
-0.024
-1.24%
jan 1, 2008
1.887
-0.023
-1.2%
jan 1, 2009
1.865
-0.022
-1.17%
jan 1, 2010
1.844
-0.021
-1.13%
jan 1, 2011
1.824
-0.02
-1.08%
jan 1, 2012
1.806
-0.018
-0.99%
jan 1, 2013
1.789
-0.017
-0.94%
jan 1, 2014
1.774
-0.015
-0.84%
jan 1, 2015
1.761
-0.013
-0.73%
Ranking of countries by current statistics by years


Comments: